Click here to purchase the complete E-book of this tutorial
What is Dendogram?
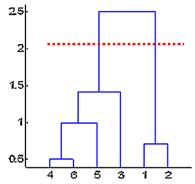
The standard output of hierarchical clustering is a dendogram. A dendogram is a cluster tree diagram where the distance of split or merge is recorded. Dendogram is a visualization of hierarchical clustering.
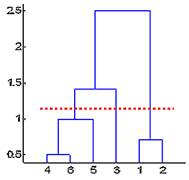
Using dendogram, we can easily specify the cutting point to determine number of clusters. For example, in the left dendogram below, we set cutting distance at 2 and we obtain two clusters out of 6 objects. The first cluster consists of 4 objects (number 4, 6, 5 and 3) and the second cluster consists of two objects (number 1 and 2). Similarly, in the right dendogram, setting cutting distance at 1.2 will produce 3 clusters.
In the next sections , I will explain how hierarchical clustering and dendogram can be computed manually or using MS Excel only.
Click here to purchase the complete E-book of this tutorial
Do you have question regarding this Clustering tutorial? Ask your question here