![]()
Share this: Google+
< Contents | Previous | Next >
Why Probability Distribution is Very Important?
Let us start with the concept of probability distribution. When you have a numerical data, you can create bins to categorize your data in increasing values. The distribution of the frequency count of the bins is called frequency distribution. The relative frequency measures probability.
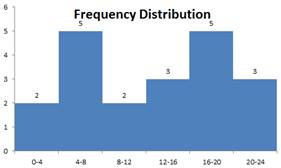
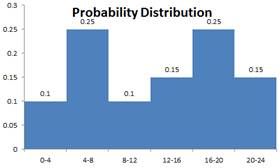
For instance, you have the following 20 data:
14.8, 4.2, 17.9, 11.4, 7.2, 6.8, 11.5, 1.8, 20.6, 17.3, 14.9, 7.6, 18.8, 16.4, 20.9, 5.1, 17.2, 3.7, 13.7, 21.9
Suppose we create 6 bins (0-4, 4-8, 8-12, 12-16, 16-20 and 20-24). The count of the number of data in each bin is called frequency. Whenthe frequency is divided by the total frequency, you get relative frequency, which is the same as probability. In the table below, 2/20 *100%=10%, 5/20*100%=25% and so on.
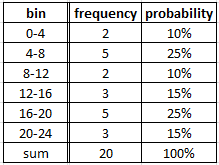
The plot of bins versus the frequency is called frequency distribution. The plot of bins versus probability is called probability distribution. To simplify, let us call both frequency distribution and probability distribution as distributions . When the data is real number, the probability distribution is also called probability density function (pdf) or density , in short.
Why probability distribution is important? Probability distribution is very important in data analysis because it summarizes the whole data into a single figure. After you plot the distribution of your data, you can gain many new knowledge based on the shape, spread, and peak of the distributions. You can identify the skewness of the probability distribution. You can characterize the central tendency from distribution. If you can identify the distribution of your data, you can compare and fit the distribution of your data with some theoretical distribution and you will gain new knowledge about the underlying phenomena of your data.
The peak of a distribution (the bin with the highest frequency) is called mode of the distribution. When a distribution as a single peak, it is called unimodal distribution. When a distribution contains more than mode, it is called multi-modal distribution.
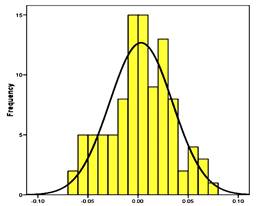
When you learn basic statistics, you learn many properties of several important theoretical distributions. One of the most common used theoretical distribution is Normal distribution , or sometimes called Gaussian distribution after the inventor, Carl Friedrich Gauss about 1809. We can use the term Normal and Gaussian interchangeably. Gaussian distribution is a unimodal where the mode is equal to the mean and median of the data as shown in the black curve in the figure below. The curve is symmetric.
The probability density function of a Normal distribution is formulated as
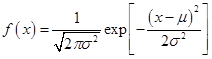
The Gaussian Distribution has two parameters: mean
![]() and variance
and variance
![]() . Mean is the average of the data. It measures the central tendency of the data. Mean is formulated as
. Mean is the average of the data. It measures the central tendency of the data. Mean is formulated as
![]() .
.
Variance is the average of square deviation of the data from the mean and it is formulated as
![]() .
.
Variance measure the spread or the variation of the data about the mean. The square root of variance is called standard deviation .
Normal distribution, or Gaussian distribution are often found in many daily life applications. For instance, height and weight of a human tend to be normally distributed. Traffic speed is tend to be normally distributed. Any error of measurements tend to be Gaussian. In statistics, there is a well-known theorem called Central Limit theorem stated that the sum or average of any independent and identical distribution is tend to be normally distributed. Thus, Gaussian or Normal distribution can be obtained from sum of any identical distributions as long as they are taken independently.
Summary
In summary, this is what you have learned in this section:
- Probability density distribution is very important summary of your data
- Normal distribution is the most commonly used theoretical probability distribution.
- Gaussian distribution is another name of Normal distribution.
- Gaussian distribution has two parameters, mean and variance.
- The peak of distribution distinguishes unimodal and multimodal distributions.
In the next section, you will learn about mixture distribution .
These tutorial is copyrighted .
Preferable reference for this tutorial is
Teknomo, Kardi. (2019) Gaussian Mixture Model and EM Algorithm in Microsoft Excel.
http://people.revoledu.com/kardi/tutorial/EM/