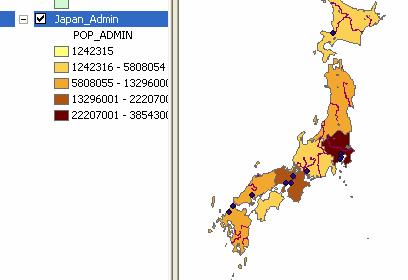
Suppose you have created a layer of Japan Administrative Boundary Map from last section . That layer contains data of population of the region and you want to make Choropleth map.
This can be easily done in ArcGIS using the following steps:
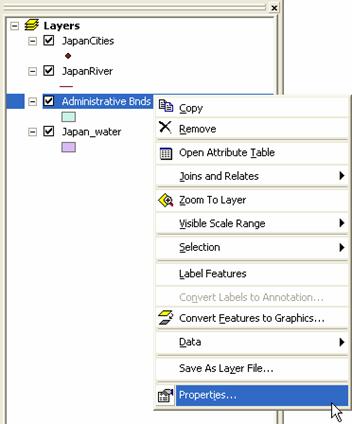
- In the left panel, that is table of content of the layers; do right click on layer Administrative Boundary . A pop up menu will be shown.
- Click on the pop up menu: Properties
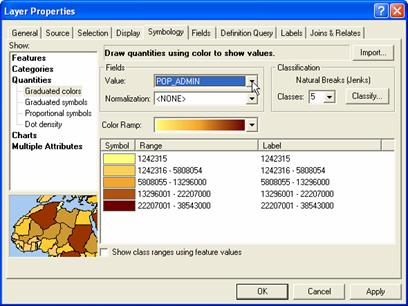
- In the Layers Properties dialog, choose Symbology Tab
- Select Show> Quantities > Graduate Colors
- Click field Value: Pop_Admin
- Select the color ramp you want to specify. ArcGIS automatically put the color and category
- Optionally, you may change the color of each category or change the number of category.
- Click OK button
This tutorial is copyrighted .
Preferable reference for this tutorial is
Teknomo, Kardi (2015) Introduction to GIS. https:\\people.revoledu.com\kardi\ tutorial\GIS\