<
Previous
|
Next
|
Contents
>
Association Rules of Market Basket Analysis
Let us call the items currently seen by the customer as X (independent variable) and the other items associated to those current items as Y (dependent variable).
If you have only two items, name A and B, we have only two possible association rules:
![]()
![]()
If you have only three items, name A, B and C, we have 12 possible association rules:
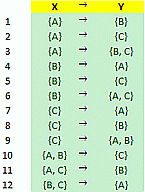
Notice that the independent variable (X) is combination of items up to d-1, where d is the number of items. Dependent variable (Y) is the combination of the set difference between all items and items listen on the dependent variable.
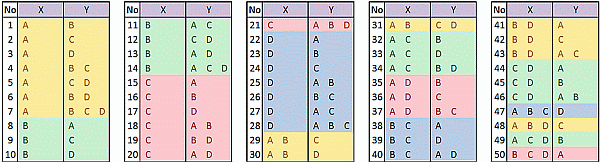
For our demonstration example, we have 4 items that generate 50 possible association rules as shown below.
In general, the total number of possible association rules, R, is exponential to the number of items, d, which is according to the following formula (Tan, Steinbach & Kumar, 2006):
![]()
|
Total number of items, d |
1 |
2 |
3 |
4 |
5 |
10 |
100 |
500 |
|
Total possible association rules, R |
0 |
2 |
12 |
50 |
180 |
57002 |
5.15378E+47 |
3.636E+238 |
Clearly if we have thousand numbers of items, it is impossible to compute the frequency of all possible association rules and most of them will not have enough support anyway. In the near future, I will introduce Apriori algorithm that would help to prune the number of possible associate rules. In the next section, you will how to compute the two measurements of support and confidence using brute force method.
<
Previous
|
Next
|
Contents
>
Rate this tutorial or give your comments about this tutorial