<
Previous
|
Next
|
Contents
>
Non Linear Regression: Power Curve
Assuming that our model is power curve
![]() , we can take logarithm to both sides of the equation.
, we can take logarithm to both sides of the equation.
![]()
To compute manually, we take logarithm to both
![]() and
and
![]() . Thus, we have model transformation
. Thus, we have model transformation
![]() and
and
![]() .
.
Example
Data:
![]()
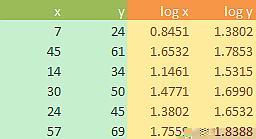
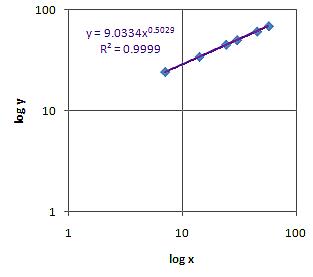
Then we plot log x versus log y and if the data is fit into a power curve, we will obtain a linear model in the double log plot. For our data we find
![]() with R-squared of 0.9999. Thus, the data fits into power curve. The parameters of the power curve can be obtained from the linear model using parameter transformation
with R-squared of 0.9999. Thus, the data fits into power curve. The parameters of the power curve can be obtained from the linear model using parameter transformation
![]() and
and
![]() . In this case, we have
. In this case, we have
![]() or
or
![]() . Thus, the regression line is
. Thus, the regression line is
![]() with the same R-squared of 0.9999
with the same R-squared of 0.9999
<
Previous
|
Next
|
Contents
>
See Also
:
Regression tutorial
,
Power Rules
,
Logarithm Rules
,
Kernel Regression
Rate this tutorial or give your comments about this tutorial