Regression Functions in Excel
Microsoft Excel has built in function SLOPE and INTERCEPT to calculate linear regression slope and intercept.
Suppose we have the following 5 data points and we want to predict the population data for the year 2005 using linear regression model.

We put the independent variable Year as
![]() and dependent variable Population as
and dependent variable Population as
![]() . The Systematic procedure is as follow
. The Systematic procedure is as follow
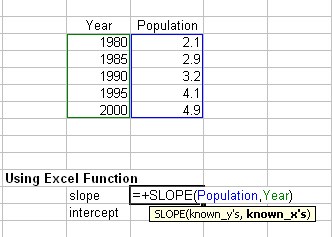
1. We put the data in two columns table in the spreadsheet as shown in the figure below. For each column, we put name of the array using MS excel menu Insert-Name-Define. For example, the name is Year and Population
2. To compute the slope of linear regression line using MS excel function, type =Slope(Population, Year) as shown in the figure below
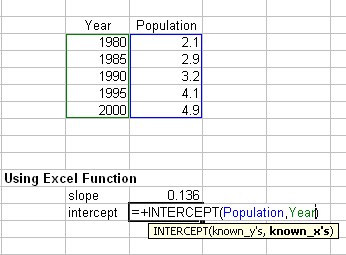
3. To determine the intercept of the linear regression line, type = Intercept (Population, Year) as shown in the figure below
4. To predict the population (Y value) for the year 2005, we can name the slope, intercept and next year cells (using insert name defined as in step 1) and then compute the prediction = next_year * slope + intercept.
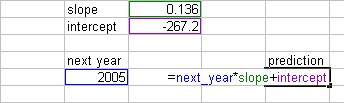
We get the same results as the manual computation that the slope is 0.136, intercept is -267.2 and the prediction of population for the year 2005 is 5.48 (times hundred thousand people).
Send your comments, questions and suggestions
Preferable reference for this tutorial is
Teknomo, Kardi (2015) Regression Model using Microsoft Excel. http://people.revoledu.com/kardi/tutorial/Regression/