Regression Model for Prediction
Suppose you have data of population (in hundred thousand) of a medium size city over 20 years (based on every 5-year census) as shown table 1. You want to predict the population in the year 2005. How do you predict that population? There are many ways to predict the future based on the previous data. We are going to learn one of the famous methods called regression model .
Table 1 data for regression analysis

Let us plot the data above into a graph. One point in the graph represents data of one year. Since we have 5 data, thus we have five points.
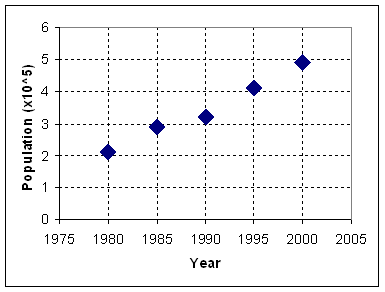
From the figure above, we can see that the five points seems to have a linear relationship (could be model by a straight line)! Can you guess a line that will pass around those points? That line is not necessarily passed through any point of the data, but it should be the best model that we can use to represent the five points.
We have several proposals here. I will plot three seems best proposal:
- Blue line (slash dot line)
- Red line (solid line)
- Green line (small dot line)
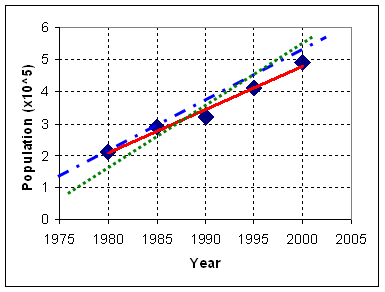
If we could make that best line model, we may use it to predict the next point of population in the year 2005. The prediction point is just an intersection of vertical line that pass through year 2005 and the best line model. Which one of the three proposals is the best line model?
To determine the best line model, we need a criterion to say that it is the best. We can generate many criteria. Can you think of any criteria that we can use to say that that line is the best one?
For example, some of you may suggest the following criteria
- The best line model should pass through the most point of the data
- The best line model should pass through the first point of the data (the blue line or slash dot line do that)
- The best line model should be in the middle of all points of the data (perhaps, the green line or small dot line do)
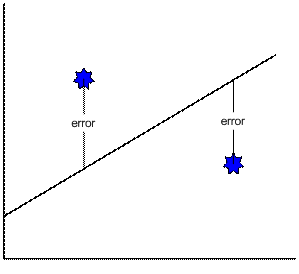
All of those criteria above are good for each of you, but how do we know that the criteria above is the best? We need an objective criterion, rather than subjective criterion by saying "It is the best because I said so!" Objective criterion needs measurement. Perhaps we can measure the error (mistake) between the model (as prediction of the data) and the real data points. The diagram below is showing how we measure the error. When the point data is above the line model, we say that the error is positive, while if the line model is above the data, we say the error is negative.
We need an agreement here that our best line model is really the optimum line. Some of you may say that what we need to do is to sum all the error and the best line model is the line model that minimizes the sum of error. That seems a great idea, but it does not work because some error is positive and some of the error is negative. The sum of error may be zero. If we sum all the error, we may get many lines. How do we solve this problem?
The most common agreement among scientist and engineers, mathematician and statistician is a criterion that the best line model should minimize the sum square error . When we square the error, regardless it is positive or negative, the number become positive.
Now we come back to our data, we measure the sum of square error among the three proposal lines and the results are shown in the table below. We may obtain that the red line give the minimum sum of square error (=0.09) among the three proposals.
|
year |
Population data (hundred thousand) |
Blue line or slash dot line (square error)
|
Red line or solid line (square error)
|
Green line or small dot line (square error)
|
|
1980 |
2.1 |
2.10 (0.00) |
2.08 (0.00) |
1.66 (0.19) |
|
1985 |
2.9 |
2.90 (0.00) |
2.76 (0.02) |
2.60 (0.09) |
|
1990 |
3.2 |
3.70 (0.25) |
3.44 (0.06) |
3.54 (0.12) |
|
1995 |
4.1 |
4.50 (0.16) |
4.12 (0.00) |
4.48 (0.14) |
|
2000 |
4.9 |
5.30 (0.16) |
4.80 (0.01) |
5.42 (0.27) |
|
|
SSE= Sum Square Error |
( 0.57 ) |
( 0.09 ) |
(0.81) |
The spreadsheet example can be downloaded from next page
.
In above procedure we have proposed several best line models by guessing it and then we find the best line model based on the criteria of minimizing sum square error. The problem is in the guessing of the line. Can we obtain the best line model without guess it?
Fortunately, the answer is yes. The best line model can be computed using formula of linear regression. We denote
![]() as the mean of
as the mean of
![]() . Notation
. Notation
![]() is the estimated of
is the estimated of
![]() , that is represented by the best line model. The
linear regression formula
is
, that is represented by the best line model. The
linear regression formula
is
|
|
|
|
|
|
|
|
|
|

Using above formula, we get best line model is
![]()
Now we can predict the number of population in the city for year 2005. By inputting 2005 to the year we get population = 5.48 (x hundred thousand persons).
Send your comments, questions and suggestions
Preferable reference for this tutorial is
Teknomo, Kardi (2015) Regression Model using Microsoft Excel. http://people.revoledu.com/kardi/tutorial/Regression/