The purpose of supervised learning such as SVM is to classify objects (people, customers, things, etc.) into two or more classes based on based on training data . The training data consist of measurable quantitative features such as size, weight, or preference score or income etc. For each training data, you also have predetermined classes based on observation on the objects. The predetermined classes behave like the teacher to tell what is right or wrong. That is why it is called supervised learning. The typical example of SVM problem goes like the example below.
For example,
factory ABC produces very precise high quality chip rings that their qualities are measured in term of curvature and diameter. Result of quality control by experts is given in the table below.
|
Curvature |
Diameter |
Quality Control Result |
|
2.947814 |
6.626878 |
Passed |
|
2.530388 |
7.785050 |
Passed |
|
3.566991 |
5.651046 |
Passed |
|
3.156983 |
5.467077 |
Passed |
|
2.582346 |
4.457777 |
Not-Passed |
|
2.155826 |
6.222343 |
Not-Passed |
|
3.273418 |
3.520687 |
Not-Passed |
As a consultant to the factory, you get a task to set up the criteria for automatic quality control. Then, the manager of the factory also wants to test your criteria upon new type of chip rings that even the human experts are argued to each other. The new chip rings have curvature 2.81 00 and diameter 5.456782. Can you solve this problem by employing SVM?
In above example, we have training data consists of two numerical features, curvature and diameter. For each data, we also have also have predetermine groups: Passed or Not-Passed the manual quality control. You are going to create a model to classify the training data.
Once you have made the model, you can use the model to predict the classification or the group of an unknown new instance of the data. In this case, the unknown instance data is the new chip rings that have curvature 2.8100 and diameter 5.456782.
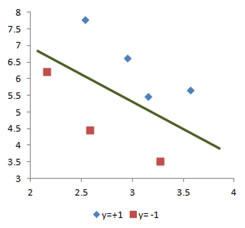
If you do scattered plot of the two dimensional training data in the last section, you can see that the two classes of the data are clearly separated. We can put any line to separate the two groups of the training data. Two dimensional training data that can be separated by a line (or a plane in 3D, or a hyper plane in high dimension) is called linearly separable data.
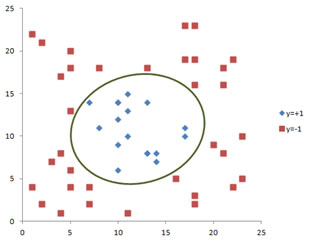
A 2 dimensional training data that cannot be separated by a line (similarly 3D training data that cannot be separated by a plane and so on), is called linearly non-separable . The example of training data below should be separated by an ellipse, not a line. Thus, the training data below is linearly non-separable.
The above example is the very typical supervised learning problem. You were given a set of training data with its classes and you will create a model to separate the classes. Then, you will get a new data of the same features and you should predict the class of this new data using your model.
Supervised learning problem can be solved using supervised learning algorithm such as SVM, LDA, K-Nearest Neighbor, Decision Tree, Neural Network, Naive Bayes, and many others. What makes SVM interesting is the ability to classify complex problems which have linearly non separable cases with non-linear decision boundary. What is more about SVM is its ability to find the optimum non-linear decision boundary. Using SVM, you will not get any arbitrary non-linear decision boundary to separate the classes in the training data. In fact, SVM algorithm will give you the optimum linear separation in high dimensional feature space that will be the equivalent to the optimum non-linear decision boundary in the original data set. In this tutorial, you will learn step by step numerical solution on how to implement SVM learning and optimization and prediction of both linearly separable and linearly non-separable cases and using only Microsoft Excel without any macro programming.
Do you have question regarding this SVM tutorial? Ask your question here !