
Mahalanobis Distance
Mahalanobis distance is also called
quadratic distance
. It measures the separation of two groups of objects. Suppose we have two groups with means
 and
and
 , Mahalanobis distance is given by the following
Formula

The data of the two groups must have the same number of variables (the same number of columns) but not necessarily to have the same number of data (each group may have different number of rows).
In Matlab, the code is as follow:
function d=MahalanobisDistance(A, B)
% Return mahalanobis distance of two data matrices
% A and B (row = object, column = feature)
% @author: Kardi Teknomo
% http://people.revoledu.com/kardi/index.html
[n1, k1]=size(A);
[n2, k2]=size(B);
n=n1+n2;
if(k1~=k2)
disp('number of columns of A and B must be the same')
else
xDiff=mean(A)-mean(B);
% mean diff row
vector
cA=Covariance(A);
cB=Covariance(B);
pC=n1/n*cA+n2/n*cB;
% pooled covariance
matrix
d=sqrt(xDiff*inv(pC)*xDiff');
% mahalanobis distance
end
The code above requires computation of Covariance matrix, which code is given below
function C=Covariance(X)
% Return covariance given data matrix X (row = object, column = feature)
% @author: Kardi Teknomo
% http://people.revoledu.com/kardi/index.html
[n,k]=size(X);
Xc=X-repmat(mean(X),n,1);
% centered data
C=Xc'*Xc/n;
% covariance
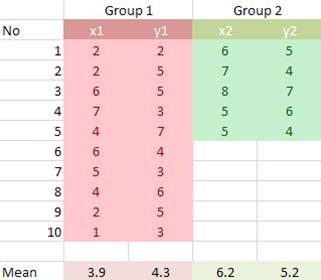
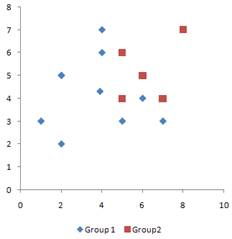
Example
Suppose we have two groups of data, each of group consists of two variables (x, y). The scattered plot of data is shown below.
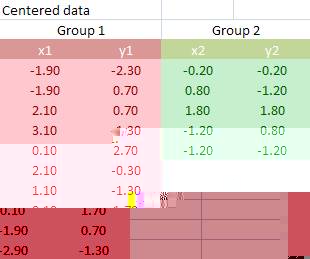
First, we center the data on the arithmetic mean of each variable.
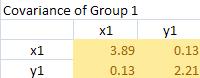
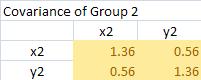
Covariance matrix of group
 is computed using centered data matrix


It produces covariance matrices for group 1 and 2 as follow
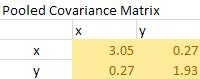
The pooled covariance matrix of the two groups is computed as weighted average of the covariance matrices. The weighted average takes this form
 .
.
The pooled covariance is computed using weighted average (10/15)*Covariance group 1 + (5/15)*Covariance group 2 yields
The Mahalanobis distance is simply quadratic multiplication of mean difference and inverse of pooled covariance matrix.
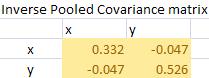
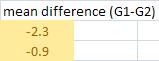
To perform the quadratic multiplication, check again the formula of Mahalanobis distance above. When you get mean difference, transpose it, and multiply it by inverse pooled covariance. After that, multiply the result with the mean difference again and you take the square root. The final result of Mahalanobis distance is
![]()
Spreadsheet example (MS Excel) of this Mahalanobis computation can be downloaded here .
Use the interactive program below to compute Mahalanobis distance. If you like this program, please recommend it to your friends.
Samples of Applications of Mahalanobis Distance
- Mahalanobis distances in habitat selection studies
- Mahalanobis distance for skin color range for face detection
- Mahalanobis Distance for Leadership and Education Science
- Mahalanobis distance in robotic
This tutorial is copyrighted.
Preferable reference for this tutorial is
Teknomo, Kardi (2019) Similarity Measurement. http:\people.revoledu.comkardi tutorialSimilarity