By Kardi Teknomo, PhD .
![]()
<
Previous
|
Next
|
Contents
>
Monte Carlo Simulation based on Observational Data
This section of tutorial we will demonstrate how to generate random distribution and Monte Carlo Simulation based on the observation data.
Suppose we have a frequency relative based on observation of traffic in one leg of an intersection like this:
|
Observation |
Frequency |
Frequency Relative |
Cumulative |
|
Go straight |
500 vehicles/hour |
50% |
50% |
|
Turn Left |
200 vehicles/hour |
20% |
70% |
|
Turn Right |
300 vehicles/hour |
30% |
100% |
|
Total |
1000 vehicles/hour |
100% |
|
We want to generate random distribution based on the observation table above. Since random-distribution generation is inverse distribution, we can inverse the cumulative distribution above. The procedure is very simple: generate random number
![]() (that is according to standard uniform distribution) using computer, then
(that is according to standard uniform distribution) using computer, then
If
, then generate "Go Straight"
If
, then generate "Turn Left"
If
, then generate "Turn Right"
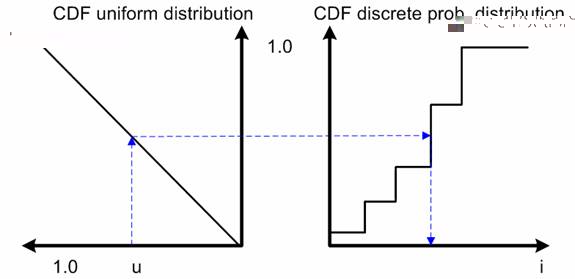
The observation distribution is generated using transformation of standard uniform distribution as shown in diagram above.
The MS excel worksheet for this example can be downloaded here
The results of this simple Monte Carlo simulation are some statistics and sampling distribution for each observation.
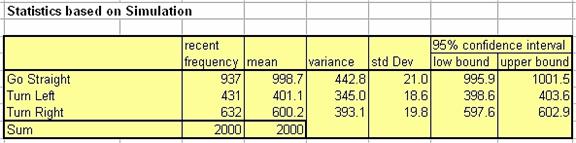
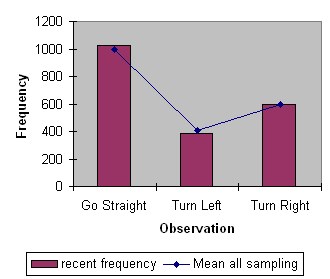
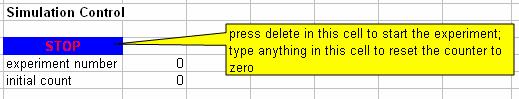
In the worksheet, 2000 data are generated for each experiment. One Monte Carlo Numerical experiment is a replication of the survey assuming that the observation sample is the correct representation of the data. You can make as many experiments as you like simply by pressing F9 continuously after you delete the STOP cell. To reset the counter, you may type any letter or number in that particular cell
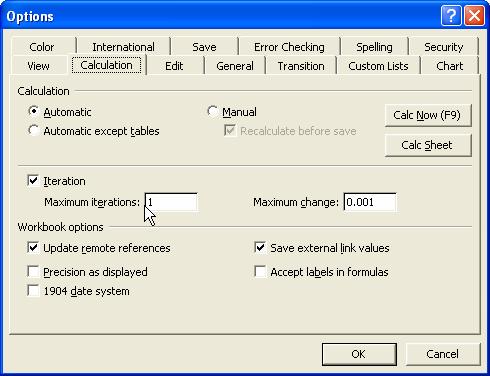
The worksheet is using iteration of Excel (no Macro inside). Before simulation, make sure that the iteration option ON and the calculation mode is set to Automatic. The maximum iteration is set to 1 (one) as shown in the figure below. That setting is in menu Tools-Options.
The mean and variance of the results are computed using recursive average and recursive variance formula.
<
Previous
|
Next
|
Contents
>
Give your comments, questions or suggestions for this tutorial
This tutorial is copyrighted .
Preferable reference for this tutorial is
Teknomo, Kardi. Monte Carlo Simulation Tutorial. http://people.revoledu.com/kardi/ tutorial/Simulation