Share this: Google+
This tutorial is intended as an introduction to System Dynamics which is also often called System Thinking using Microsoft Excel or any Spreadsheet software. System Dynamics was introdued by Prof. Jay W. Forrester from MIT in 1960s and have been used for many applications from industrial to management, history to music. Throughout this simple tutorial I use a very simple demographic model of population to demonstrate system dynamic.
The MS Excel file companion of this tutorial can be downloaded here
.
By the end of this tutorial you will learn about
Positive and Negative Feedback Loop
Stock and Flow diagram (SFD)
Why do I use demographic model as main examples in this tutorial?
- Population is the work force for many other models. For example, the energy demand for electricity is depending on population. Traffic and public transport users are a function of population. Economic and demand for product is related to population. Benefit of facilities in project evaluation is also depending on population. Tax system, retirement system and spread of disease are also related to population. Projection of population is one of the most important aspects in many fields.
- Data for population are publicly available from many statistical office or local government. These data are useful if you want to validate your model.
- In most of the cases, the model can be assumed to be discrete in nature, thus discussion about population is easy to understand for common people.
What is System Dynamics?
System dynamics is dealing with the value of states in a system over time. For example, you think a city as a system and we simplify the states inside the city only to consider the population of the city over time.
Level, Rate, and Constant
Current state or condition in the system is called
Level
in System dynamics terminology. In our example the level variable represents the number of population in the city at year
![]() and we give notation
and we give notation
![]() . Suppose our city is located in a remote area that nobody is going out or going into the city. If we know the number of population in the city this year, we can guess what will be the population of the city next year. To do that, we need to know the birth rate and death rate. Birth rate
. Suppose our city is located in a remote area that nobody is going out or going into the city. If we know the number of population in the city this year, we can guess what will be the population of the city next year. To do that, we need to know the birth rate and death rate. Birth rate
![]() is defined as the number of birth
is defined as the number of birth
![]() divided by the total population in the city
divided by the total population in the city
![]() .
.
![]()
Death rate
 is simply counting the number of people who die in the city
![]() divided by the total population in the city
divided by the total population in the city
![]() .
.
![]()
Both birth rate and death rate are measured in a single year
![]() , but in here we assumed to be constant. Then we can say that the number of population in the city next year will be
, but in here we assumed to be constant. Then we can say that the number of population in the city next year will be
 (1)
(1)
The number of Birth
 and the number of Death
![]() are called
Rates
variables in System Dynamics terminology, while birth rate
are called
Rates
variables in System Dynamics terminology, while birth rate
![]() and death rate
and death rate
![]() are called
Constants
. [Be careful with the name here that the birth rate and death rate are constants, not Rates variable]. Rates variable measures change of the level variable between two consecutive times. Thus, rate variable can be computed from the levels. In system dynamic, level variable can only be changed through rate variable. Rate variable cannot change another rate variable directly without level variable.
are called
Constants
. [Be careful with the name here that the birth rate and death rate are constants, not Rates variable]. Rates variable measures change of the level variable between two consecutive times. Thus, rate variable can be computed from the levels. In system dynamic, level variable can only be changed through rate variable. Rate variable cannot change another rate variable directly without level variable.
Equation (1) above can be shown graphically into two types of diagrams. The first diagram is called Causal Diagram and the second diagram is called Stock and Flow Diagram .
Causal Loop Diagram (CLD)
Causal loop diagram is only showing the causal relationship of the level and rates in a system. Only in a very special case the constant will also be shown in causal loop diagram (for example to emphasize the goal of the system).
The causal loop diagram above can be read as follow. The number of baby birth in the city causes increase in population and higher number of population causes higher number of birth. This part of loop is called positive feedback loop as shown in red. The number of people who die in the city is a function of population. Higher the number of population, higher the number of death people. However, higher the numbers of death peoples in the city will effect into reduce the number of population. This part of loop is called negative feedback loop.
Sign of Arrow Head
In causal loop diagram, which one is the rate and which one is the level is not clear. We think them as factors that influence each other dynamically. Notice that the influence can be positive or negative as shown in the sign near the arrow head. Positive sign indicate that higher the cause will produce higher effect, lower the cause will also lower the effect.

In contrast, negative sign in the arrow head means that higher the cause will produce lower effect, and lower the cause will create higher effect.
Positive and Negative Feedback Loop
When several arrows in the causal diagram return to one factor, it created a closing path or a loop. Since the relationship is done dynamically, it gives some feedback to the original factor, thus we call it a feedback loop . There are two kinds of feedback loops: positive feedback loop and negative feedback loop. You can easily distinguish positive and negative feedback loop from the multiplication of all arrow signs in the loop.
For example in the causal diagram below we have two feedback loops. Birth and Population make one feedback loop while Death and Population make the second feedback loop. Look at the sign of the all arrows in the loop and multiply them, then you will get the sign of the loop.
Remember that multiplication of two signs has the following rules:

Once you know the sign of the feedback loop, you can guess the qualitative behavior of that loop. Positive feedback loop tend to grow or to decline without bound. Negative feedback loop tend to adjust itself (sometimes oscillate) to some intended value. Positive feedback loop make the system unstable but negative feedback loop tend to stabilize the system. Positive feedback loop is the locomotive that makes the system move, while negative feedback loop is the control or to steer the locomotive. Positive feedback loop will diverge and move away from the goal while negative feedback loop will converge and guide to the goal. The goal itself in dynamical system may represent either the equilibrium value or saddle point. [Read more about equilibrium of dynamical system here ]
Stock and Flow Diagram (SFD)
The second way to represent population dynamic of equation (1) is through Stock and Flow Diagram (SFD) proposed by Jay W. Forrester in 1971. I put again equation (1) in here for clarity.
 (1)
(1)
The flow diagram corresponding to the equation is illustrated below.
Stock and flow diagram shows the causal relationship of the level and rates and constants in a system. In contrast to causal diagram that does not distinguish rate from level and constant, stock and flow diagram distinguish the three variables. Sometimes, it also distinguish what kind of flow is moving in the diagram (whether it is physical material, goods, equipment, people, concrete things or abstract things such as information, decision, money, order etc.) in the arrow link. In this tutorial, I don't distinguish these types of flows for simplicity. Level variable is represented by rectangle, Rate variable is using valve symbol, Constant and auxiliary variable are represented by a point or just name of the constant. Cloud symbols represent respectively source and sink, where the flow originated and vanished.
In this example, the flow is that moving in the diagram number of people in the city. Rate variable Birth (
![]() ) is influenced by a constant name birth rate (
) is influenced by a constant name birth rate (
![]() ) and the level variable name Population (
) and the level variable name Population (
![]() ). Since the rate variable is pointing to the level, the sign is positive. Rate variable name Death (
). Since the rate variable is pointing to the level, the sign is positive. Rate variable name Death (
![]() ) is influenced by a constant name death rate (
) is influenced by a constant name death rate (
![]() ) and the level variable name Population (
) and the level variable name Population (
![]() ) as indicated by the black arrow. Because the rate variable Death is pointing out of the level, the sign is negative. These sign related to the arrow is only working for rate variables. The two black arrows pointing out of the level variable have positive sign because they are not rate variables and because higher population will affect the rate variables (Birth and Death) to be higher and lower population will also affect the rate variables to be lower [just in case you forget, see again:
sign of arrow head
].
) as indicated by the black arrow. Because the rate variable Death is pointing out of the level, the sign is negative. These sign related to the arrow is only working for rate variables. The two black arrows pointing out of the level variable have positive sign because they are not rate variables and because higher population will affect the rate variables (Birth and Death) to be higher and lower population will also affect the rate variables to be lower [just in case you forget, see again:
sign of arrow head
].
Sometimes, you want to related system dynamic with dynamical system. Order of the system is determined by the number of level variable. If there is one level variable, it is called first order system. If there are two level variables, it is called second order system, and so on.
Numerical Example
To give you more understanding, here is simple numerical example to compute the equation (1). I put again equation (1) in here for clarity.
 (1)
(1)
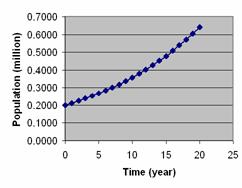
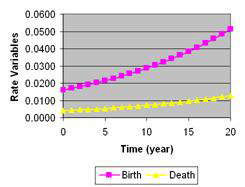
For example, the birth rate is known to be 8% and death rate is 2% and at time 0 (i.e. some reference year), the population is 200 thousand. We can use MS excel to compute this system dynamic. The MS Excel file companion of this tutorial can be downloaded here
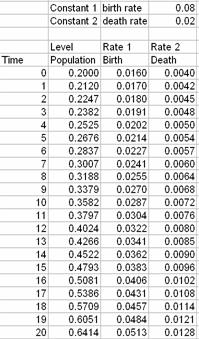
The result shows that the population may reach 500 thousand in 16 years if the rate is constant. Graphical results of Level variable and Rate variables are plotted below.
Exercise:
Using the MS Excel companion of this tutorial , you can try some scenarios. What will happen if the constant birth rate is the same as the death rate? What will happen if the death rate is higher than the birth rate? How rapid is the decline?
Suppose you know the real population in 20 years periods, can you determine what are the constant birth rate and death rate? This last question is dealing with calibration of the model using real data. (Clue: use Solver in MS Excel)
See Also : Dynamical System tutorial
This tutorial is copyrighted .
Preferable reference for this tutorial is
Teknomo, Kardi. System Dynamics Tutorials. 2019. https:\\people.revoledu.com\kardi\ tutorial\SystemDynamic\