![]()
Share this: Google+
< Contents | Previous | Next >
What is Mixture of Distribution?
In the previous section you have learned that probability distribution is very important summary of your data. Most commonly used distribution is normal distribution. In this section, you will see how we model more mixture of normal distributions.
In many real world applications, however, when you plot the distribution of your data (to summarize your data) there are many chances that the distribution of your data is not unimodal and not symmetric. You often see multi modal distributions in real world applications. Suppose you have collected some data. After you plot the density distribution of your data, you find out that the histogram of your data contains several peaks as shown below.
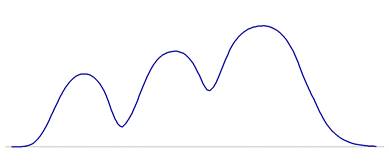
When this happen, then you may think that your data may actually contain of a mixture distribution . As if there are several density distributions, combine together and make the distribution of your data. For example, in the figure above, you may think your data consists of 3 components of Normal density distributions blend together such that the boundaries of those components of normal distributions are not so clear but the peaks are still clear.
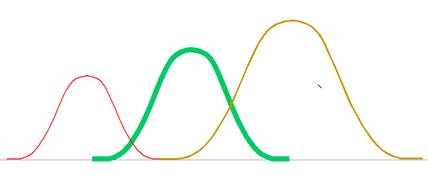
Let us call each density distribution as a component of the mixture distribution. In our example, the mixture distribution contains three independent component distributions. We can assume that each component is a Normal Distribution (which often called Gaussian distribution). Normal distribution is most often distribution to be found in nature, so it must be our first assumption to use. Thus, we say that your data have a Gaussian mixture distribution with three components as redrawn in the figure below.
Summary
Let us summarize what you have learned so far in this section:
- Your data can be summarized into a density distribution.
- Most commonly used theoretical distribution is Gaussian.
- When you're your data is not unimodal, you can use Gaussian Mixture model
Next, learn about Maximum Likelihood and EM algorithm .
These tutorial is copyrighted .
Preferable reference for this tutorial is
Teknomo, Kardi. (2019) Gaussian Mixture Model and EM Algorithm in Microsoft Excel.
http://people.revoledu.com/kardi/tutorial/EM/