
Share this:
Google+
<
Previous
|
Contents
|
Next
>
1. What is Principal Component Analysis (PCA)?
The Principal Component Analysis (PCA) is one of the most useful data modeling for feature extraction, dimensional reduction and visualization. As one of the classical statistical technique, proposed nearly a century ago (Pearson in 1901 and Hotelling in 1933) PCA has been widely used in many applications.
The principal components (PC) are the directions where the data have the largest variance and capture most information content of the data. Using PCA, many variables can be reduced into a few components. The success of PCA lies on its capability to capture more significant underlying-structure of the data, and at the same time, it removes the noise or trivial variation in the data.
Example 1
Suppose you have several objects. On each object, you have several features based measurement data on its strength of material (in Newton), mass (in kg), Pressure (in Pascal) and cost (in USD). The five data points are represented in a data table as follow. Notice that in PCA, the variables are numerical values (i.e. no nominal or ordinal data or data with string of labels).
|
Object |
Strength (N) |
Mass (Kg) |
Pressure (Pa) |
Cost ($) |
|
A |
1 |
2 |
3 |
4 |
|
B |
5 |
2 |
1 |
9 |
|
C |
3 |
5 |
7 |
1 |
|
D |
5 |
7 |
4 |
6 |
|
E |
2 |
1 |
6 |
2 |
Because we have five objects and four variables, the data table data above are represented by five points in four dimensions. We know we cannot draw four dimension because our world is just three dimension. One of the tasks in Data Science or Statistical data mining is use the principal component analysis (PCA) to reduce the number of dimension such that we can visualize and simplify the data. Say, we want to reduce the four dimension data into two dimension such that the five data points can be plotted look like the following chart. Based on this 2D-plot, we will know which data point has high value in both feature-1 and feature-2, which is object D.
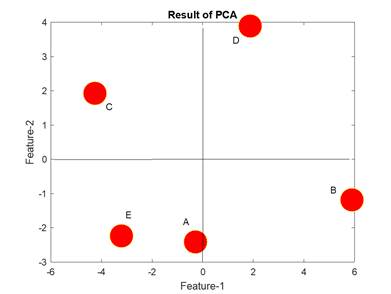
Such basic 2D plot above is very useful to the whole picture of the data just in one figure. Marketing map can be generated based on PCA. The next section would explain why we need PCA and explain PCA in qualitative way.
Click here to purchase the complete E-book of this tutorial
Rate this tutorial
Do you have question regarding this PCA tutorial? Ask your question here