Excel Data Analysis Add Ins
Microsoft Excel has excellent Data Analysis menu and one of them contain regression.
To use the data analysis menu (suppose your MS excel do not have it), you need to install the Add-ins: Go to menu Tools > Add Ins > check the Analysis Tool pack and then press OK button. Next time when you open the Tools menu again, you will see Data Analysis in the bottom of Tools menu.
You may download the spreadsheet example of this tutorial here
To use Regression from Data Analysis:
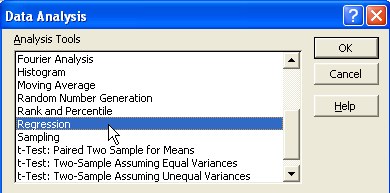
1. Click menu Tools > Data Analysis and you will see Data Analysis dialog. Scroll down and you will see Regression. Select the Regression and click OK button.
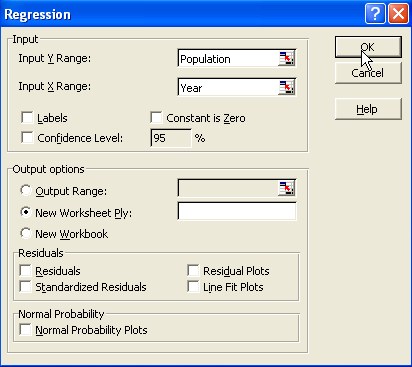
2. Regression dialog will pop up and you can fill the Input Y range and input X range. If you have defined the name of your data (e.g. Population and Year) using menu Insert > Name >Define, you can just type the name of your data instead of searching it. When you click the OK button in the regression dialog, MS excel will automate the procedure to compute regression for you.
Suppose we have the following 5 data points and we want to predict the population data for the year 2005 using linear regression model.

We put the independent variable Year as
![]() and dependent variable Population as
and dependent variable Population as
![]() .
.
Here is the result of the Data Analysis of Regression. There are many numbers on it and I will tell you only what is important:
First, you need to examine the Coefficients. These are the intercept and the slope of the regression analysis. The slope is 0.136, intercept is -267.2 for the 5 observations data above. Thus, your regression model is
![]()
Next, your regression model needs to pass all the three criteria below
- The R square must be bigger than 0.80
- The significant F (from ANOVA) must be smaller than 0.05
-
The absolute value of t-statistics must be larger than 1.96 for
 =0.05 and must larger than 1.645 for
 =0.10
=0.10
If you cannot pass any of the three criteria above, you should plot your data and check whether your data is really a linear model (could be model by a straight line). If your data is not linear, you may transform it to linear model or you should you non-linear regression instead. The explanation on why these criteria are important is quite long and I would rather ask you to read statistical book for the explanation.
For our example, it seems all the criteria above could be passed by our model. Using this regression model, we can predict the number of population in the city for year 2005. By inputting 2005 to the year we get population = 5.48 (x hundred thousand persons).
![]()
Send your comments, questions and suggestions
Preferable reference for this tutorial is
Teknomo, Kardi (2015) Regression Model using Microsoft Excel. http://people.revoledu.com/kardi/tutorial/Regression/