Share this: Google+
Chaos Ginger Bread Man Using MS Excel
Do you remember ginger bread man cookies? The purpose of this tutorial is to make fun using Mathematical Chaos Theory and MS Excel. I will guide you in a very gentle way to make Ginger bread man cards using Microsoft Excel.
You may download the MS Excel companion of this tutorial here
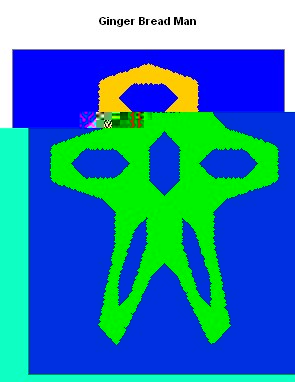
Below are some examples of the cards
|
|
|
|
|
|
The mathematics of Chaotic Ginger Bread man is very easy. You only need to use two formulas:

The equation above is called difference equation or iterative map or dynamical system ( click here to learn more about it in my other tutorial ). If you never heard about it, do not be afraid with its name, you will be able to learn it very soon in this tutorial.
![]() is a function Absolute, sometimes written as
is a function Absolute, sometimes written as
![]() to make all
to make all
![]() into positive value.
into positive value.
To make plot of Ginger bread man, you need to put many points. Each point have coordinate name
![]() . The interesting part is the relationship between one points coordinate to the other point. Each coordinate depend on the previous coordinate, in a certain manner that written in the equation above.
. The interesting part is the relationship between one points coordinate to the other point. Each coordinate depend on the previous coordinate, in a certain manner that written in the equation above.
Let us call
![]() to be the order of sequence that one point will influence the other point. We start with
to be the order of sequence that one point will influence the other point. We start with
![]() and we assume the first point, say
and we assume the first point, say
![]() . Then we apply the formula above to get the next points.
. Then we apply the formula above to get the next points.
For example, for
![]() , we have
, we have

For
![]() , we have
, we have

The following table gives the
![]() coordinate for the first eleven points
coordinate for the first eleven points
|
n |
X |
Y |
|
0 |
-0.1 |
0 |
|
1 |
1.1 |
-0.1 |
|
2 |
2.2 |
1.1 |
|
3 |
2.1 |
2.2 |
|
4 |
0.9 |
2.1 |
|
5 |
-0.2 |
0.9 |
|
6 |
0.3 |
-0.2 |
|
7 |
1.5 |
0.3 |
|
8 |
2.2 |
1.5 |
|
9 |
1.7 |
2.2 |
|
10 |
0.5 |
1.7 |
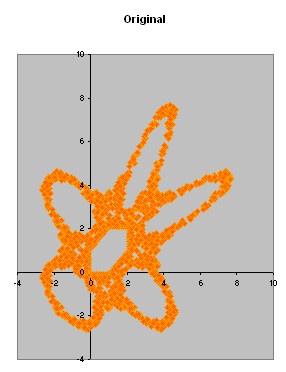
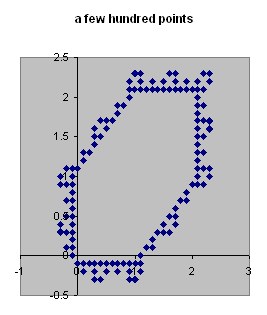
To make Ginger Bread Man Card, you need to compute thousand of points and plot those points. If you compute only a few hundred points, the results is look like the following picture
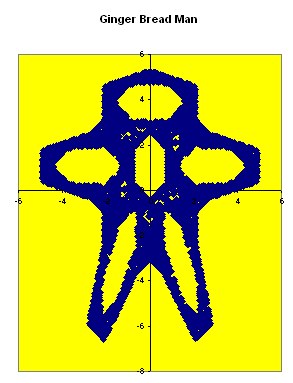
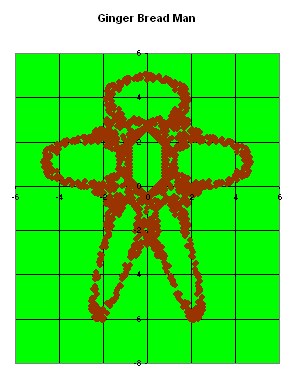
If you plot thousand points, you will get similar to the card below

To make the ginger bread man stand correctly, we need to rotate the coordinate.
Click here to learn more detail about how to rotate coordinate from my other tutorial
.
Rotation about -135 degrees (-2.356 radians) will bring the ginger bread man to stand.

To plot the graph, you use MS Excel Chart Wizard
![]() and follow the wizard until Finish.
Download the MS Excel companion of this tutorial here
.
and follow the wizard until Finish.
Download the MS Excel companion of this tutorial here
.
The formula above is included in Chaos Theory because it is very sensitive to initial condition and parameters. A few changes on the initial condition or parameters will change the graph drastically.
I hope this tutorial will encourage you to learn more about mathematics, especially Chaos and Fractal theory. Mathematics is very fun and interesting, isn't it?
See also:
MS Excel Tutorial index
,
Kardi Teknomo's Tutorial
,
Siepinski Gasket Using MS Excel
Send your comments, questions and suggestions
This tutorial is copyrighted .
Preferable reference for this tutorial is
Teknomo, Kardi (2015) Chaos Ginger Bread Man Using MS Excel. https:\\people.revoledu.com\kardi\ tutorial\Excel\Ginger-Bread-Man.html