Interpreting Cross Tabulation as Conditional Probability
In this section of tutorial, you will learn about how to interpret the cross tabulation table that you have learned in the previous section. By the end of ths section you will know about conditional probability, marginal probability and multiplication rule. Try the interactive online program to compute percentage by row, percentage by column, and percentage by total .
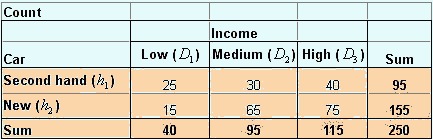
Suppose now you have result of another questionnaire survey. Table below show the result of simple survey on car dealer about relationship between income level and type of car they buy. Total 250 samples were taken about several month periods of study.
If we take
percentage by row
, we get what is called
conditional probability
. Given that it is a new car, the probability that the buyer is a high-income people is 48% =
![]() . Among the buyers of second hand car, the probability that he/she come from low-income level is 26%=
. Among the buyers of second hand car, the probability that he/she come from low-income level is 26%=
![]() . To say that
among the group of
. To say that
among the group of
![]() , the probability that it come from data of
, the probability that it come from data of
![]() is symbolized by notation
is symbolized by notation
![]() .
.
Note that the sum of column is excluded from above table because meaningless. In the following table I put the notation instead of numbers.
Another way to represent conditional probability is by taken the percentage of column as shown in the table below. Given that the buyer is come from a low-income people, the probability that she will buy a second hand car is 63% =
![]() . Among high-income people, the probability that he/she will buy a new car is 65% =
. Among high-income people, the probability that he/she will buy a new car is 65% =
![]() . We symbolize this conditional probability as
. We symbolize this conditional probability as
![]() , that is the
probability of selecting group
, that is the
probability of selecting group
![]() , given the data
, given the data
![]() .
Note that the sum of row excluded because it is meaningless,
.
Note that the sum of row excluded because it is meaningless,
Conditional Probability
![]() should be read as "the probability that A will happen given that B already has" or "the probability to select A among B". Notice that B is given first, and we find the proportion of A among B. In the following table I put the notation instead of numbers.
should be read as "the probability that A will happen given that B already has" or "the probability to select A among B". Notice that B is given first, and we find the proportion of A among B. In the following table I put the notation instead of numbers.
Compare this conditional probability above with the
probability taken from total count
below. If we take the percentage of count by the total count, the result is shown in the following table. The summation on the right are the probability of people to buy new car or second hand car, denoted by
![]() . If we take a random selection among the car buyer in that particular dealer, 62% will buy a new car and 38% will buy a second hand car. The summation on the bottom are the probability of income level, denoted by
. If we take a random selection among the car buyer in that particular dealer, 62% will buy a new car and 38% will buy a second hand car. The summation on the bottom are the probability of income level, denoted by
![]() . If we take random selection among the car buyer in that dealer, the probability that he/she comes from low-income level is 16%. The probabilities that the buyer has medium and high-income level respectively are 38% and 46%. Both
. If we take random selection among the car buyer in that dealer, the probability that he/she comes from low-income level is 16%. The probabilities that the buyer has medium and high-income level respectively are 38% and 46%. Both
![]() and
and
![]() are called
marginal probability
because they are located in the margin or edge of the table
are called
marginal probability
because they are located in the margin or edge of the table
The inner cells of the table represent the
intersection
between type of car and the income level. The probability that the buyer is buying a new car AND she/he comes from a high income level is 30% =
![]() . The probability that the buyer has low income and buying a new car is 6% =
. The probability that the buyer has low income and buying a new car is 6% =
![]() . These intersections are called
joint probability
and denoted by
. These intersections are called
joint probability
and denoted by
![]() . Note that
. Note that
![]() is equal to
is equal to
![]() because they are commutative. In the following table I put the notation instead of numbers.
because they are commutative. In the following table I put the notation instead of numbers.
Now you may notice some relationship between conditional probability, marginal probability and joint probability. These relationships are called multiplication rule
![]()
Often we use this form:
![]()
Or this form
![]()
If you notice the denominator on the right hand side is the same as the given part of conditional probability, you can use it to memorize it easily.
Example
:
Let us take example from above tables. We know that the probability that the buyer is buying a new car AND she/he comes from a high-income level is 30% =
![]() . The probability that the buyer has high-income level is 46% =
. The probability that the buyer has high-income level is 46% =
![]() . You can verify that the among high-income people, the probability that he/she will buy a new car is
. You can verify that the among high-income people, the probability that he/she will buy a new car is
![]()
This result is the same as result of table percentage by column . (see also: Bayes Rule )
Send your comments, questions and suggestions
Preferable reference for this tutorial is
Teknomo, Kardi. Data Analysis from Questionnaires. https:\\people.revoledu.com\kardi\ tutorial\Questionnaire\