Research Questions
Let us start this tutorial with a very simple questionnaire with only 6 questions. Suppose we have the following data from Parks visitors (extracted from several Parks study, the actual data may include hundreds of families and hundreds of variables to more than 10 parks in the city). Here is the meaning of each variable
- Family is the observation number of the questionnaire. One questionnaire was filled by for one family, not for individual.
- Time is a quantitative data type, measured in minutes. It is the activity time of the family in the park
-
Mode
is a nominal data type consist of four choice of mode to go to park:
- walk,
- car,
- cycling,
- bus.
The choice is mutually exclusive, that is only one mode for one family.
-
Activity
is a nominal data type consist of 6 choices of activity in the park:
- sport,
- picnic,
- reading,
- walk (including with the dog),
- meditation,
- jog.
The choices are multiple choices, that one family may have several activities in the park.
-
Satisfaction
is an ordinal scale with 5 values:
- -2 = Very dissatisfied,
- - 1 = dissatisfied,
- 0 = indifference,
- 1 = satisfied,
- 2 = Very satisfied.
It measures family satisfaction toward the park's services.
- Playground is a nominal scale (Yes or No) about the existence of children playground
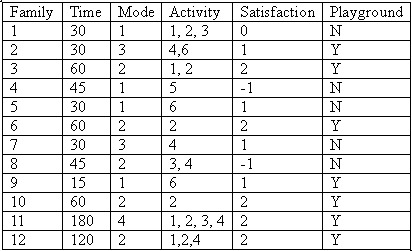
Suppose the questionnaire was distributed to 12 respondents. Each respondent is a family who visited the park. The data is show in this table
With these very limited data, we want to know the following
research questions
:
In general, what is the level of visitors' satisfaction toward parks in the city?
- What activity most people do in the park?
- What mode most people use to go to park?
- Is the existence of children playground in the park may gain higher visitors satisfaction ?
- Is there any relationship between people activity and their activity time of the family in the park
- Is there any relationship between activity time and their mode to go to park?
How are you going to do to answer those research questions? Of course, with this simple data, you can even use calculator to analyze the data manually. However, we will use MS Excel to demonstrate what kind of tools is available in MS Excel for your research.
We assume the data above is valid sample (though they are actually too little to be real sample) for the shake of demonstration purposes only.
Send your comments, questions and suggestions
Preferable reference for this tutorial is
Teknomo, Kardi. Data Analysis from Questionnaires. https:\\people.revoledu.com\kardi\ tutorial\Questionnaire\