<
Previous
|
Next
|
Contents
>
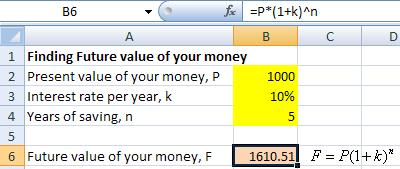
Let us start with a simple example. We know from financial formula that if you have amount of money
and you save your money in a bank with interest rate
per year for
years, then in the future, your amount of money will be
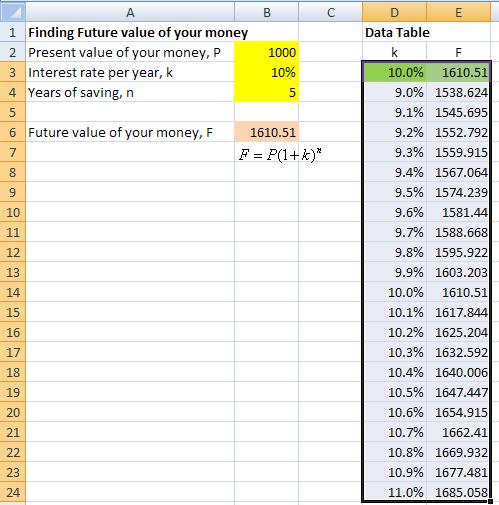
. For example, if in the beginning of this year the present value of your money is $1000 and you save it for 5 years at 10% interest rate per year, at the end of the fifth year (or the beginning of the sixth year), you will receive back $1610, 51. The MS Excel computation is shown in the figure below. We give name for each input and output cells as P, k, n and F respectively.
Now we would like to know how much you will get if the interest rate is not exactly 10% but somewhat varies between 9% and 11% per year. We can compute these values one by one by inputting the series of values of the interest rate get the future value of your money, copy to other cells. Of course, this kind of computation is wearisome if you have many values of the interest rate.
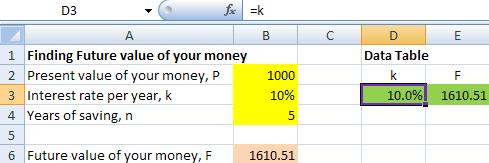
Microsoft Excel has a simple way to compute the outputs from a series of an input variable called Data Table. In this example, the output is the future value of your money (F) and the input is the interest rate (k). Below is the step by step how to do that.
1. Copy the input and outputs in a row for several columns using format [input, output 1, output2, ..., outputN]. Note that we have only one input variable, but we can have more than single output variables. Suppose we will put the data table start from cell D3. We copy the value of =k in D3 and the value of =F in E3.
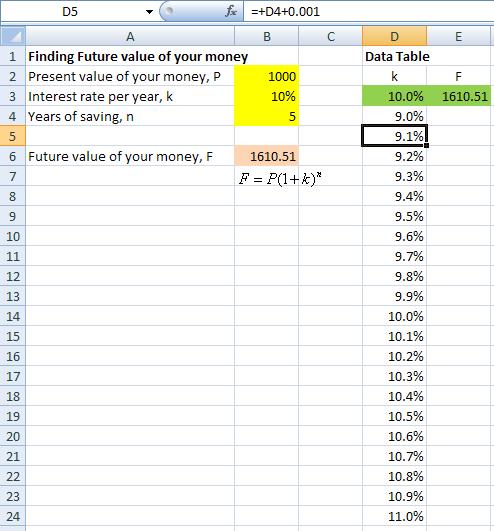
2. Make the series of values for the input variable right below the copy of input and outputs. In our example, we would like to investigate the value of interest rate from 9% until 11%. Thus, we can type 0.09 in cell D4 and then type formula in cell D5 = D4+0.001. We copy the formula of cell D5 into cell D6:D24.
3. Using your mouse or Shift and arrow, highlight the whole data table. In our example, we select cell D3:E24.
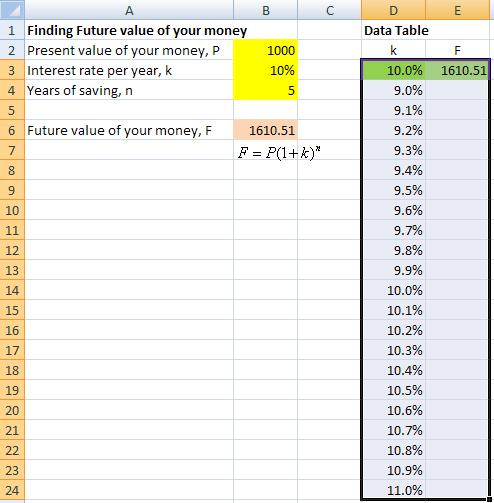
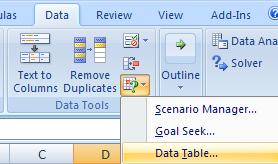
4. Then select data table from menu: Data > What If Scenarios > Data Table
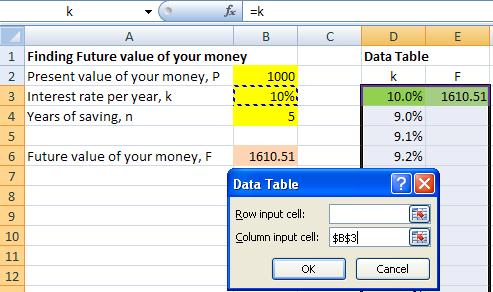
5. In the Data Table pop up window, select column input cell and point to the input variable. In our example, the input variable is interest rate per year in B3. Then click OK
6. The results of the data table are shown below.
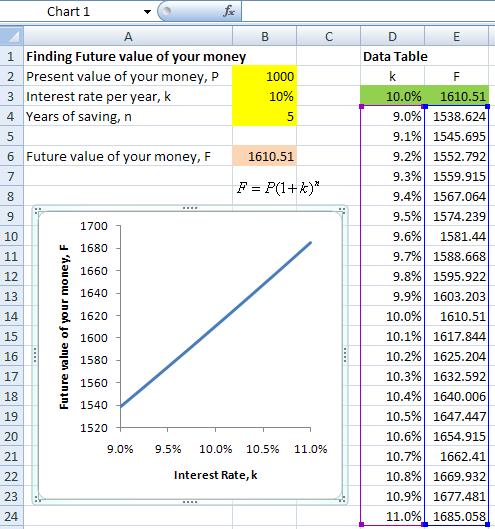
7. Optionally you can chart the result of data table
This tutorial is copyrighted .
Preferable reference for this tutorial is
Teknomo, Kardi. (2019) What If Analysis Data Table in Excel.
http://people.revoledu.com/kardi/tutorial/What-If-Analysis/