<
Previous
|
Next
|
Contents
>
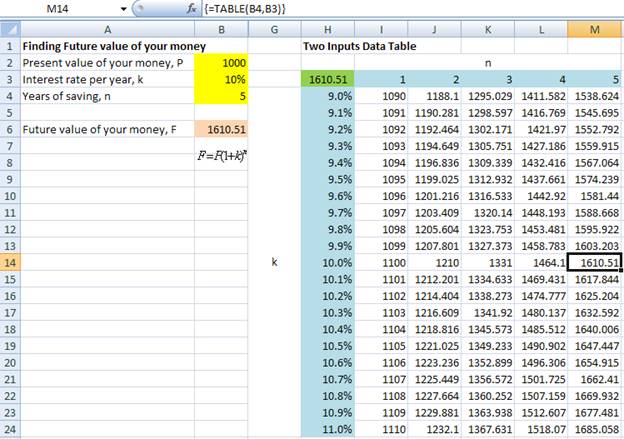
Using MS Excel Data Table, you can also obtain the output of the variation of two variables. As continuation of the same example as Data Table with one input variable, now we would like to investigate the future values of your money (F) for a variation of saving period (n) and interest rate (k).
Note that you cannot use Data Table across different sheet from your input formula.
Here are the steps:
1. We copy the value of output into data table. Note that this data table has only one output variable for two input variables. Suppose we would like to make our Data Table start from cell H3. We copy the formula of the future value of our money into cell H3 simply by put equal sign and refer to cell =B6.
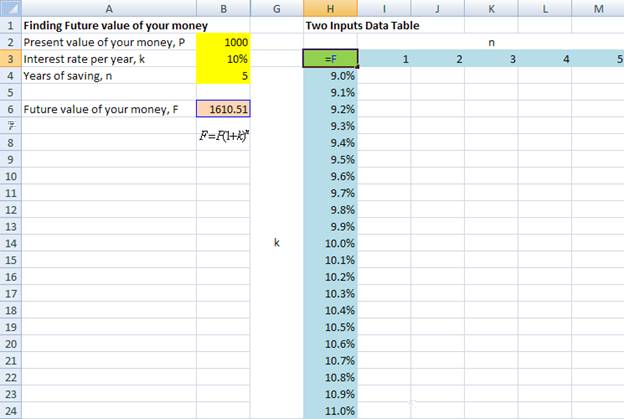
2. Fill the values of first and second variables in rows and columns as shown in the figure above.
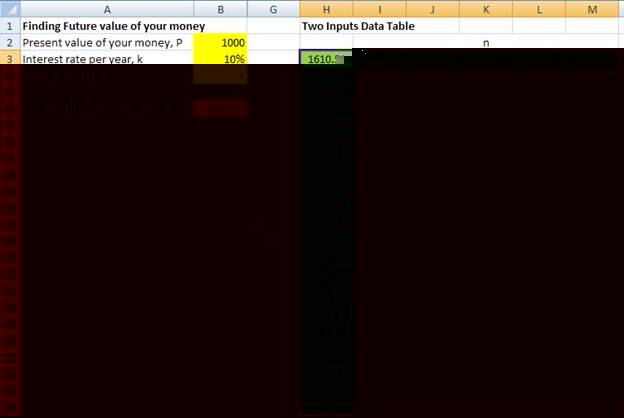
3. Select the data table. In this case, highlight cell H3:M24.
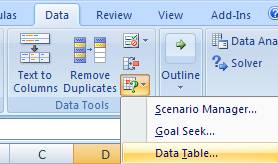
4. Select from menu: Data > What If Scenarios > Data Table
5. In the pop up window of Data table, fill the corresponding row input cell and column input cell. In our example, the year of saving (n) is located in the column and interest rate per year (k) is located in the row. The input for data table window is shown below.
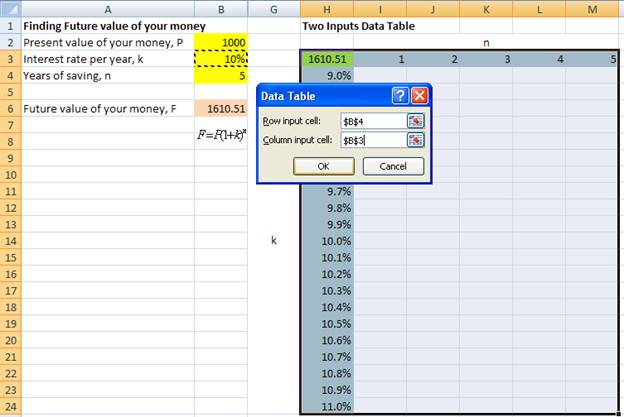
6. When you click OK in the data table window, you will get the future values of your money (F) for a given interest rate and year. You can check the correctness of your data table by comparing the output of the data table at the original data. The future value at n=5 and k=10% must be equal to 1610.51 (that is in cell M13).
This tutorial is copyrighted .
Preferable reference for this tutorial is
Teknomo, Kardi. (2019) What If Analysis Data Table in Excel.
http://people.revoledu.com/kardi/tutorial/What-If-Analysis/