<
Previous
|
Next
|
Contents
>
Break Even Point using Excel
In this section, you will learn how to compute break even point (BEP) that is a point of sales where the profit is zero using MS Excel. If you are not sure about the notation and meaning of each variable, please read previous section .
The spreadsheet example can be downloaded here.

Let us put the value of variable cost/unit,
![]() in cell C3, the fixed cost
in cell C3, the fixed cost
![]() in cell C4 and price of the product/unit
in cell C4 and price of the product/unit
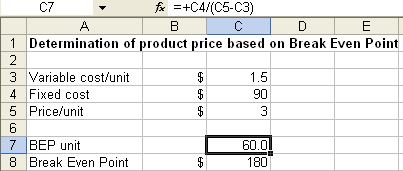
![]() in cell C5. The unit of BEP is in cell C7 computed as Equation 1 above, or C7 = C4/(C5-C3). The break-even point is C8 = C7*C5.
in cell C5. The unit of BEP is in cell C7 computed as Equation 1 above, or C7 = C4/(C5-C3). The break-even point is C8 = C7*C5.
For variable cost/unit,
![]() , fixed cost
, fixed cost
![]() and product price/unit
and product price/unit
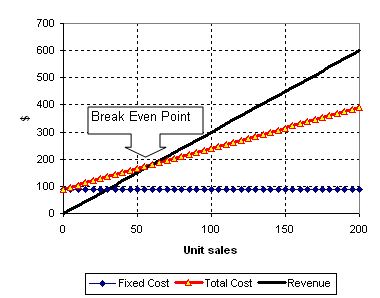
![]() , we get break-even at $180 for 60 units sales. The graph relationship of revenue, total cost and fixed cost is shown below. Clearly, the BEP is the intersection point between Revenue line and Total Cost line.
, we get break-even at $180 for 60 units sales. The graph relationship of revenue, total cost and fixed cost is shown below. Clearly, the BEP is the intersection point between Revenue line and Total Cost line.

Now suppose you want to know how much is the price should be so that the break-even point is at $200. Of course, you can manipulate it easily from equation 2 to get the product/unit
![]() . Nevertheless, you can also use MS Excel Goal seek to compute it for you.
. Nevertheless, you can also use MS Excel Goal seek to compute it for you.

Here is steps by step procedure
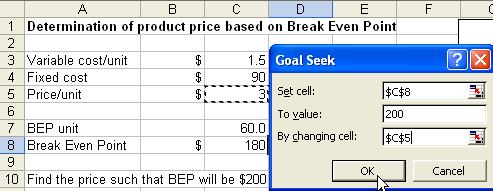
1. From the menu of MS Excel, click Tools-Goal Seek and Goal Seek dialog show up.
2. Set cell C8 ( the BEP price ) to value 200 ( target value ) by changing cell $C$5 ( initial guess of price ) and click OK button.
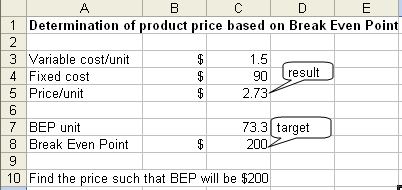
3. The result is shown in the figure below. To reach BEP of $200, you need to set the price at $2.73/unit

In the next section, you can play around interactively with the simple online BEP calculator program that I made for this tutorial.
<
Previous
|
Next
|
Contents
>
See also:
Goal Seek Tutorial
,
MS Excel Tutorial index
,
Kardi Teknomo's Tutorial
These tutorial is copyrighted .
Preferable reference for this tutorial is
Teknomo, Kardi. (2010) Determination of product price based on Break Even Point. http://people.revoledu.com/kardi/tutorial/Finance/BreakEvenPoint/
