
Numerical Example of Bootstrap Sampling
In this section of tutorial, you will go into detail on how to do bootstrap sampling. I will show you the key idea, and practical numerical example of bootstrap method. I also give you the detail "programming" for you to perform bootstrap sampling in spreadsheet such as MS Excel.
Key ideas of bootstrap sampling
As mention earlier in this tutorial, bootstrap sampling is sampling with replacement . How to do that? Suppose your sample contain only 5 observations. You label your observation into 5 balls with name
A, B, C, D, E

Put all the 5 balls on a basket. Then, from these 5 balls, you draw 1 ball randomly and record the name. After you record it, put back this ball in the basket. Make sure that you return the ball in the basket before making another random draw. This is sampling with replacement.
Repeat the work of draw another ball randomly, record the label and put back the ball to the basket until thousand of time. The recorded labels are called bootstrap sampling. You got the idea! Quite simple isn't it?
Your record may look like this
.., D, E, E, A, B, C, B, A, E etc.
Notice that because you draw with replacement, bootstrap sampling will repeat again and again. This is the properties of Bootstrap sampling.
Why do I need Boostrap Sampling?
If the idea of bootstrap sampling is so simple why do we need to do bootstrap sampling?
From a sample you can only get one statistic, for example mean. You do not know the confidence interval of this mean or distribution of this mean. Bootstrap sample give more detail on the distribution of this mean, or probability of this mean. Example in MS excel below will give you better understand on the application.
How to do that in MS Excel? This section of the tutorial will give you the detail on how to do that. The Excel file contains no macro, only pure spreadsheet.
Download the worksheet example companion of this tutorial here
Suppose we have 30 data of original sample that we take from an observation or experiments or questionnaire survey. We put this data in several rows so that we can see them.
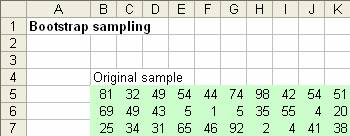
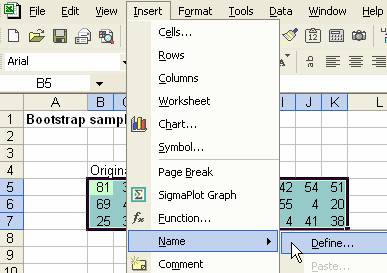
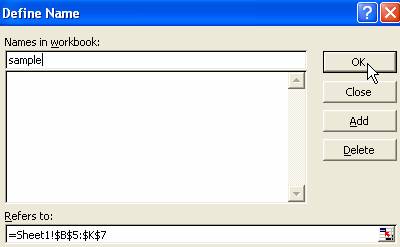
1. Select the region of original sample, and use menu Insert > Name > Define and type "sample" to the original sample and click OK button.
2. In any other cell below this original sample, say cell B10, type
=INDEX(Sample,ROWS(Sample)* RAND ()+1,COLUMNS(Sample)* RAND ()+1)
The word 'sample' in the formula above is refering to name (Menu: Insert-Name-Define) as specified in step 1 above. This is to take a random sample from the original sample (re-sampling) with replacement. It simply uses Index function to locate random row and random column as the new sample within the range location of original sample. We have made the first bootstrap sample.
3. Copy cell B10 to B10:K210 (or as much as you want). This is to create as many bootstrap sample. Let us consider each row as single sample (for the sake of simplicity we just make one sample consists of only 10 data) and we have made 201 sample.
4. The nest step is to compute bootstrap statistics. You can derive any statistics, and in here for example, we use only mean, median, inter quartile range and standard deviation.
=AVERAGE(B10:K10) to compute the mean of one sample
=MEDIAN(B10:K10) to compute median
=QUARTILE(B10:K10,3)-QUARTILE(B10:K10,1) to compute inter quartile range
=STDEV(B10:K10) to compute standard deviation
5. Copy the bootstrap statistics above to all rows of bootstrap samples (i.e. M10:P210)

You can use F9 to draw new random sampling. F9 is symbol for function F9 is used by MS excel to recalculate iteration.
Bootstrap Confidence interval
To get the confidence interval
![]() of a bootstrap statistics, we can sort the statistics and use this formula:
of a bootstrap statistics, we can sort the statistics and use this formula:
![]()
Using MS Excel, we can use excel function SMALL to sort and get the
![]() value.
value.
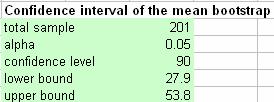
Remember that the sampling distribution is not necessarily Normal distribution. You cannot use
![]() for
for
![]() because the distribution is unknown. Only if you data come from Normal distribution the results of the two formulas will be the same approximately.
because the distribution is unknown. Only if you data come from Normal distribution the results of the two formulas will be the same approximately.
Charting Frequency Distribution
If you would like to see the graph, we can make bin and compute the frequency of the bootstrap statistics. For example, you are interested in the distribution of mean. Since the sample values are in the range of 0 to 100, we can make 10 bins.
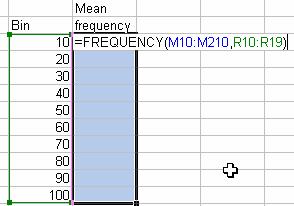
Suppose we make the bin values in cell R10:R19 and the bootstrap statistics of mean is in the range of M10:M210.
- Type =Frequency(M10:M21,R10:R19) in cell S10
- While the cursor still in cell S10, select region S10:S19 by highlighting it with mouse
- Press F2, you will see exactly like the figure below
4. Press together CTRL-SHIFT and ENTER and you get all the frequency of the bin.
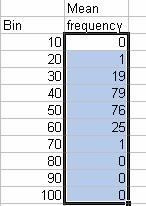
5. Now you can add sum to the frequency and compute relative probability and then graph the bin and the probability
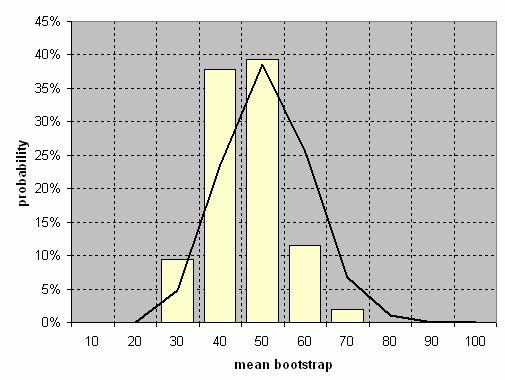
I hope you can see the point here. Only within your sample, you can estimate the statistics. For example, in here, the statistical estimator is sample mean . Using bootstrap sampling, you can do beyond your statistical estimators. You can now get even the distribution of your estimator and the statistics (such as confidence interval, variance) of your estimator.
In contrast to Monte Carlo simulation which you need to know the distribution of the population, in Bootstrap sampling you also create your own data (based on the observation) without knowing the distribution of the population. All you need to know is your sample. Using very simple idea of sampling with replacement, we can make powerful results. Quite amazing, isn't it?
See also: Monte Carlo Simulation
This tutorial is copyrighted .
Preferable reference for this tutorial is
Teknomo, Kardi. Bootstrap Sampling Tutorial. http://people.revoledu.com/kardi/tutorial/Bootstrap/
