Analysis of One Variable
Given the questionnaire data that have been coded one number for each value, in this section of tutorial, you will learn to perform the first data analysis: to compute descriptive statistics and frequency analysis. You can go directly to the interactive programs , or in this page I will explain using MS Excel.
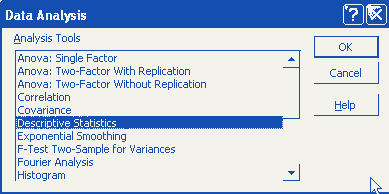
Microsoft Excel has excellent Data Analysis menu and one of them contain Descriptive statistics. To use the data analysis menu (suppose your MS excel do not have it), you need to install the Add-ins: Go to menu Tools - Add Ins then check the Analysis Tool pack and then press OK button. Next time when you open the Tools menu again, you will see Data Analysis in the bottom of Tools menu.
To use Descriptive statistics tool from the Data Analysis:
- Click menu Tools - Data Analysis and you will see Data Analysis dialog. Scroll down and you will see Descriptive Statistics. Select it and click OK button.
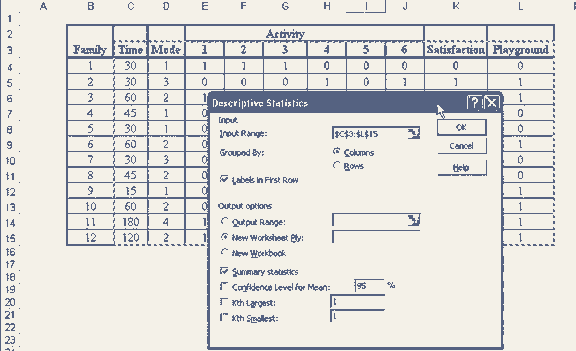
- You will get Descriptive Statistics dialog form. In the Input range, select range of your data that you want to be analyzed. Include the label in the first row and check that check box. Check also the Summary statistics check box and then click OK button.
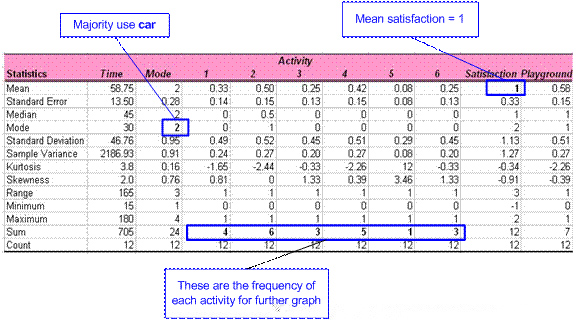
The result of Descriptive Statistics tool, after a few formatting, is shown in the figure below.
You may download the spreadsheet example of this tutorial here
There are many results of data analysis, but do not be confused with all those numbers. Be focus only on your research questions . (That is why you need to formulate your research questions before to do any research as an important step). Which one of your research questions could be answered using the results of your analysis?
From the figure above, you see that the mean satisfaction is 1 (from the scale - 2 to 2 ). You may conclude that people are quite satisfied with the park conditions. This answers the first research question of "In general, what is the level of visitors' satisfaction toward parks in the city?"
You may also see that the sum of values in each activity may produce frequency that you may graph it further.
|
Activity |
frequency |
Relative frequency |
|
(1) sport |
4 |
18.2% |
|
(2) picnic |
6 |
27.3% |
|
(3) reading |
3 |
13.6% |
|
(4) walk (including with the dog) |
5 |
22.7% |
|
(5) meditation |
1 |
4.5% |
|
(6) jog |
3 |
13.6% |
|
Sum |
22 |
100.0% |

We may conclude that the majority of the family who visit the parks are doing picnic or walking with their dog. This answers the second research question of ?What activity most people do in the park?"
From the Mode of Mode, you may conclude that majority of family who visit the parks are using car. This answers the third research question of "What mode most people use to go to park?"
Send your comments, questions and suggestions
Preferable reference for this tutorial is
Teknomo, Kardi. Data Analysis from Questionnaires. https:\\people.revoledu.com\kardi\ tutorial\Questionnaire\