Cross Tabulation
In the previous section, you have learn how to perform computation of descriptive statistics and frequency analysis from our questionnaire data. In this section, you will learn how to analyze relationship between several variables in the questionnaire data. In particular, cross tabulation (pivot table) or sometimes called contingency table and chi-square independent test.
Using the data that we have formatted , we want to answer the next research questions :
4. Is the existence of children playground in the park may gain higher visitors satisfaction ?
5. Is there any relationship between people activity and their activity time of the family in the park?
6. Is there any relationship between activity time and their mode to go to park?
Because those research problems are about relationship between two variables, we need to do what is called Cross Tabulation. Cross Tabulation (or CrossTab for short) is a frequency table between two or more variables. For readability, it is normally involve less than 4 variables. Cross Tabulation table has many name for different people. Actually they refer to the same thing. Some statistician called it Contingency Table while MS excel call it Pivot Table .
You may want to go directly to try the interactive programs that I made or you can learn the explanation of it in this page.
In Microsoft Excel, CrossTabs can be automated using Pivot Table. You may use either Pivot Table icon in the toolbar or using MS Excel Menu Data - Pivot Table and Pivot Chart Report .
![]()
When you click the toolbar or menu, Pivot Table wizard will pop up, click Next
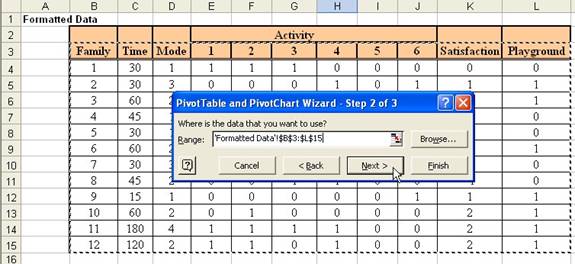
In the step 2 of the wizard, you highlight the data including the label of the data in the top as shown in the following figure
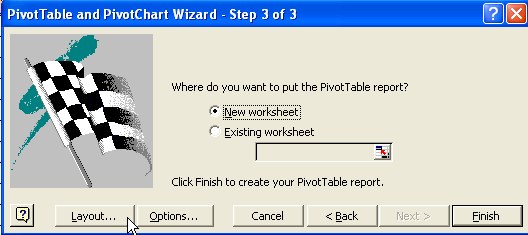
In step 3 of the Pivot Table Wizard, select Layout button
To answer the relationship between variable Playground and Satisfaction , drag and drop the name of the variables on the right into the diagram. Put Satisfaction button in the row and Playground button in the column and make another drop to put Satisfaction once again to the Data . It will appear as Sum of Satisfaction . After that, double click the last button ( Sum of Satisfaction ) and Pivot Table Field dialog will appear. Select summarized by Count and then click the OK button twice.
When you go back to the Step 3 of Pivot table wizard, click Finish button.
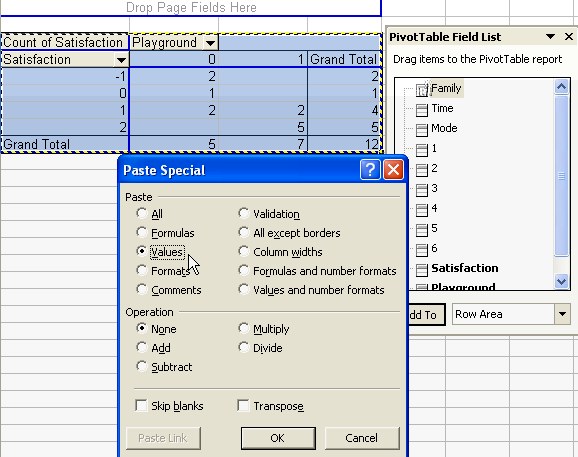
MS excel will automatically create the Cross Tabulation table. Personally, I don't like to use it directly because it may contain very long formula. Thus, I prefer to highlight this Pivot Table and use Menu Edit Copy (CTRL-C).
Then select another cell, and use menu Edit - Paste Special . Click Values options and click OK button
After we reformat, we need to count the Independent values of the table. We need to do so because we want to know whether variable Playground has relationship with variable Satisfaction , or not. We will perform some simple test, called Chi-square test . If the result of the chi-square test shows that, variable Playground is independent from variable Satisfaction, and then we cannot conclude any relation between the two variables. Otherwise, we can conclude the relationship. Sound easy, isn't it?
To get the independent values, we to compute

Don't bother with the formula if you don't understand notation
![]() . It is just a symbol for summation. (
click here to learn more about this sigma notation
) The meaning is like this: to get the cell of independent table, we need to multiply the total of rows with the total of columns then divide this with the total of all data.
. It is just a symbol for summation. (
click here to learn more about this sigma notation
) The meaning is like this: to get the cell of independent table, we need to multiply the total of rows with the total of columns then divide this with the total of all data.
Example, for Satisfaction = 1 and Playground = 1, we have data of 2 respondents. The total of rows is 7 and total of columns is 4, the total of all data is 12. Then, the independent value for that cell is 7*4/12 = 2.333. Do the same thing for all cells in the table we get the table of independent values. This table has meaning that if variable Playground is 100% independent from variable Satisfaction , then the contents of the cells must be equal to these values.
To make sure that variable Playground has relationship (not independent) from variable Satisfaction , we need to put the degree of independent as small as possible, say less than 5%. The number of 5% is called the error or mistake that may happen by chance (who can avoid that we get it out of luck). Some people called it significant level .
The problem now is how to get the index to indicate degree of independent? The mathematician are very smart, they invented probability to represent that "degree of independent". To determine that probability, we need to compute the difference between the observe values (from the Pivot table) and the expected values (from the Independent table), square this difference, and then divide with the expected value (to get the same unit back) and we sum for all entries of the table. In short,

To get the probability, we need to compute degree of freedom (df), that is
![]()
The probability can be obtained using MS Excel function = CHIDIST(
![]() ,
,
![]() ). Now the
Chi-square test
is sound like this:
). Now the
Chi-square test
is sound like this:
If probability is lower than 0.05, the two variables have relationship, otherwise we cannot conclude any relationship between the two variables in the contingency table.
As shown in the figure above, the value of probability is 0.048, thus we may conclude that there is a relationship between existences of playground with satisfaction level of parks' visitors. This answers the research question of "Is the existence of children playground in the park may gain higher visitors satisfaction ?" positively.
Note that if follow old statistical book, it will ask you to compare the Chi-square value (
![]() ) with the Chi-square from the table. You can get Chi-square value from the table in MS Excel using function =CHIINV(probability, degree of freedom). If you put the probability 0.05 and 3 degree of freedom, you will get 7.8147 (look at your Chi square table if you have it, whether it is the same number). Because you have put probability here, you should use the value of the Chi-square to compare. The
chi-square test
will sound like this
) with the Chi-square from the table. You can get Chi-square value from the table in MS Excel using function =CHIINV(probability, degree of freedom). If you put the probability 0.05 and 3 degree of freedom, you will get 7.8147 (look at your Chi square table if you have it, whether it is the same number). Because you have put probability here, you should use the value of the Chi-square to compare. The
chi-square test
will sound like this
|
If your computed chi-square is larger than the Chi-square value from the table, the two variables has relationship, otherwise we cannot conclude any relationship between the two variables in the contingency table. |
Another note that MS excel also provide function =CHITEST (actual-range, expected range) to simplify the computation of probability. In this case, you don't need to create the third table to compute the value of Chi-square. The result is directly probability that you can compare with the value of significant level (i.e. 0.05).
For the next research questions, we can do the same steps as above in the new worksheet.
To get the Pivot table of Activity and activity time , drag and drop the time button in the column and all activities (1 to 6) button in the data . Let it be in the sum field because our activity data is binary.
Following the same steps as above, we gain the probability that variable Activity is independent from Time is 46.2%. Since it is larger than 5% as required in the Chi-square test, we conclude that there is no relationship between people activity and their activity time of the family in the park. This answers the research questions of ?Is there any relationship between people activity and their activity time of the family in the park??
For the last research question, we use variable Time in the Column of Pivot table and count of Mode in the data diagram. The results is shown in the figure below.
Since the chi-square probability is larger than 0.05, we conclude that there is no relationship between mode to go to parks with the activity time in the park. This answers negatively to the sixth research questions of "Is there any relationship between activity time and their mode to go to park?". Try the interactive online program to compute chi-square independent test .
You may download the spreadsheet example of this tutorial here
You have seen simple data analysis using MS excel Data Analysis ? Descriptive Statistics and Pivot Table can be used to analyze your data from questionnaire survey. In the next section, you can play around with the online interactive program for data analysis
Send your comments, questions and suggestions
Preferable reference for this tutorial is
Teknomo, Kardi. Data Analysis from Questionnaires. https:\\people.revoledu.com\kardi\ tutorial\Questionnaire\