By Lyra Filiola

Bootstrap Statistics for Mean
This section of tutorial will demostrate how you can easilly use bootstrap method to estimate the accuracy of mean or arithmetic average. Bootstrap method will be used in estimating the standard error, bias, and confidence interval of the mean statistic . Histogram of the mean will also be shown.
The script code of R for this section can be downloaded here
. You may see the explanation of the Script at the bottom of this section.
Say, we have one set of sample consist of 10 data and we want to use mean to describe the center of the data. Type the following command in R console to generate 10 random data from normal distribution with mean 10, standard error 8:
> x<-rnorm(10,10,8)
Now we have generated 10 data and stored them into a variable name x. To see the content of x, just type the variable name
> x
[1] 9.1698255 5.9537146 -0.6101523 16.3371213 20.5365773 10.8225232
[7] 13.0104373 19.2245197 4.6300335 11.2541662
Variable x is a vector with 10 elements and the index of the element start with number [1]. This list is continued in the second row, start with index [7].
Suppose you have download the script I provided here and save it in directory name " D:/MyDirectory ", then you can load this script into R with the following command
> source("D:/MyDirectory/bootmean.R")
Alternatively you can use menu File > Source R code... and pointing to the script file.
Then you can apply the dataset x to the " boot.mean " script. Inside this script is a function [boot.mean<-function(x,n,k,alpha)] that has the following inputs:
x : original sample
n : number of bootstrap sample
k : number of bootstrap replication
alpha : significance level
Suppose you want to generate 10 samples, each sample has 500 replication from the orginal data set x with 10% significant level, you type
> boot.mean(x,10,500,0.1)
The output is as follows:
Mean Original Sample : 11.03288
Mean Bootstrap Sample : 11.00582
bootstrap bias = -0.02705805
bootstrap standard error = 2.034639
90 % Confidence Interval for Mean Statistic:
lower bound = 7.59778
upper bound = 14.23857
>
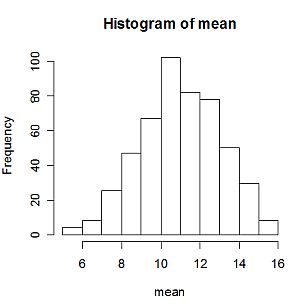
This output show that using 500 Bootstrap replications, we found that the mean statistic for our data in vector x, which is 11.033. The bias is only about -0.027, and its standard error is about 2.034. Then the 90% confidence interval for mean statistic is (7.6, 14.24). The histogram of mean of Bootstrap samples is nearly normal because the number of Bootstrap replications is quite large.
The rest of this section will discuss about how the code of boot.mean works. The code itself is described as follow
I boot.mean<-function(x,n,k,alpha)


       {


       II meanx=mean(x)


       cat("Mean Original Sample :",meanx,"\n")
III meanbootsamp=NULL for(i in 1:k) { data=sample(x,n,replace=TRUE,prob=NULL) meansamp=mean(data) { meanbootsamp[i]=meansamp } }IV meanboot=mean(meanbootsamp) cat("Mean Bootstrap Sample :",meanboot,"\n")V bootbias=meanboot-mean(x) cat("bootstrap bias =",bootbias,"\n") cat("\n")VI varboot=var(meanbootsamp) seboot=sqrt(varboot) cat("bootstrap standard error =",seboot,"\n") cat("\n")VII lobound=quantile(meanbootsamp,(alpha/2)) upbound=quantile(meanbootsamp,(1-(alpha/2)))cat(((1-alpha)*100),"% Confidence Interval for Mean Statistic:","\n") cat("lower bound =",lobound,"\n") cat("upper bound =",upbound,"\n")VIII hist(meanbootsamp) }
I will explain the code part by part.
Part I
This program named "
boot.mean
" and the input as follows:
x : original sample
n : number of bootstrap sample
k : number of bootstrap replication
alpha : significance level
Part II
This part calculates mean of the original sample. Our statistics of interests are standard error, bias, and confidence interval. Internal R Function "mean" is to calculate mean statistic. Internal function "
cat
" is used to show a sentence in output.
Part III
This part performs the replication of bootstrap in calculating mean statistics. First, mean defined as null. Then, the calculation of mean is repeated until k replications. Mean of each Bootstrap sample are stored in a vector name "
meanbootsamp
".
Part IV
Mean is calculated from all the mean of the Bootstrap samples, that is meanbootsamp. Mean of meanbootsamp named as
meanboot
. This is the overall mean.
Part V
Bias of Bootstrap is defined as the difference of mean of mean Bootstrap samples and mean of original data. In this script, bias Bootstrap named as "
bootbias
" and defined as the difference of
meanboot
and mean original sample.
Part VI
Variance of Bootstrap estimator for mean is defined as variance of mean Bootstrap samples. Then, standard error for Bootstrap estimator is defined as square root of its variance.
Part VII
This part demonstrates how to build confidence interval for Bootstrap estimator. It is simply as finding its
![]() th quantile as its upper bound and its
th quantile as its upper bound and its
![]() th quantile as its lower bound.
th quantile as its lower bound.
Part VIII
It is never useless to show the histogram of Bootstrap estimator.
This tutorial is copyrighted .
Preferable reference for this tutorial is
Filiola, L., (2006) Bootstrap Computation using R, http://people.revoledu.com/kardi/tutorial/Bootstrap/Lyra/index.html