<
Previous
|
Next
|
Contents
>
Phase Diagram
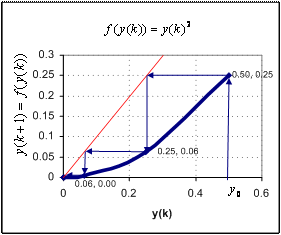
We can be determined graphically the equilibrium value of a difference equation, if it is exist, by plotting the value of
![]() as horizontal axis and
as horizontal axis and
![]() as the vertical axis. The point of intersection of the graph of the difference equation with the line
as the vertical axis. The point of intersection of the graph of the difference equation with the line
![]() is the equilibrium values.
is the equilibrium values.
Start from initial value
![]() , we take vertical line to the graph, and then take horizontal line to the line
, we take vertical line to the graph, and then take horizontal line to the line
![]() . From here we again take vertical line to the graph. Repeating this task will eventually lead us to the equilibrium point if the point exists.
. From here we again take vertical line to the graph. Repeating this task will eventually lead us to the equilibrium point if the point exists.
Example
Example below is for iterated function
![]() for
for
![]() = 0.5 lead to zero equilibrium point.
= 0.5 lead to zero equilibrium point.

Stability
Suppose at some point the solution of a difference equation deviates form the equilibrium value. Will the solution return to the equilibrium value? This problem is called stability problem of the difference equation.
Suppose we are studying the growth of a population and suppose the population has reached a point where for all intents and purposes it is not changing. We say that the population is in equilibrium with its surrounding and the value of the population is the population equilibrium value. Now suppose there is a disaster and 10% of the population is suddenly killed. Will the population return to its original equilibrium value? Will it oscillate? Will it become extinct? Will the population find a new equilibrium value?
We called this kind of equilibrium value is attracting or stable. Regardless the choice of
![]() , the solution of a stable difference equation will stabilize itself even if it is temporarily perturbed from its course. The equilibrium is called unstable or repelling if the solution is perturbed, it remains at its perturbed value and does not return to its original value.
, the solution of a stable difference equation will stabilize itself even if it is temporarily perturbed from its course. The equilibrium is called unstable or repelling if the solution is perturbed, it remains at its perturbed value and does not return to its original value.
See:
Numerical example
<
Previous
|
Next
|
Contents
>
Preferable reference for this tutorial is
Teknomo, Kardi (2015) Difference Equation Tutorial. https:\\people.revoledu.com\kardi\ tutorial\DifferenceEquation\
