<
Previous
|
Next
|
Contents
>
Non-Linear Regression: Logarithmic Curve
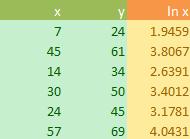
Data:
![]()
Suppose we would like to try that our model would be logarithmic
![]() . Using model transformation
. Using model transformation
![]() and
and
![]() we obtain
we obtain
![]()
Its mean we need to take the natural logarithm to the value of x in our data and then plot into semi logarithm paper. If the data is fitted with logarithm curve, we will obtain a straight line with high degree of R-squared. The computation of natural log and semi logarithm plot is given below.
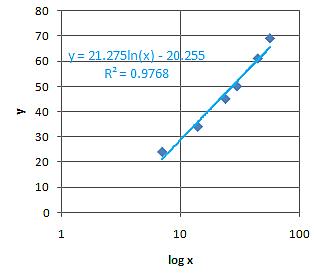
Plotting ln x and y, we get linear model of
![]() with R-squared of 0.9768.
with R-squared of 0.9768.
Thus, the data also fits into logarithm curve. The parameters of the logarithm curve can be obtained from the linear model using parameter transformation
![]() and
and
![]() . In this case, we have
. In this case, we have
![]() or
or
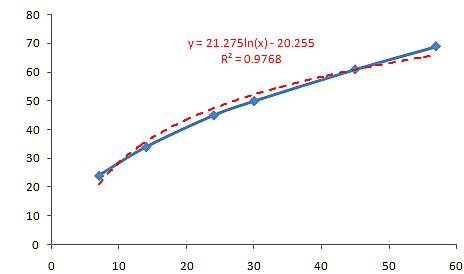
![]() . Thus, the regression line is
. Thus, the regression line is
![]() with the same R-squared of 0.9768.
with the same R-squared of 0.9768.
The plot of logarithmic curve (dash red line in figure below) produces quite good result with R-squared 0.9768.
<
Previous
|
Next
|
Contents
>
See Also : Regression tutorial , Power Rules , Logarithm Rules , Kernel Regression
Rate this tutorial or give your comments about this tutorial