
<
Previous
|
Next
|
Contents
>
 M/M/s Queuing Optimization Spreadsheet
is now available only at $9.99
M/M/s Queuing Optimization Spreadsheet
is now available only at $9.99
M/M/1 Queuing System
Now we will go into the detail of the performance for a special simple queuing system where there is only single server and the arrival distribution of customers follows Poisson distribution and the distribution for service time follows Exponential distribution.
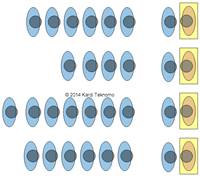
M/M/1 queuing system means we have one queue per server. It does not mean that you cannot have multiple servers. A diagram above shows 4 servers with 4 queues. Therefore, each of these servers are computed using M/M/1 queues.
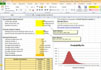
Use the M/M/1 queuing calculator below to experiment to solve queuing problem of a single server. For instance, what happen to the queuing performance if you can improve the service rate by 20%? You can also compare the performance of 4 servers with 4 queues (4*M/M/1) with the performance of 4 servers with 1 queue (M/M/4). Check the queuing calculator for M/M/s here .
M/M/1 Queuing system is also equivalent to M/G/1 queuing system with standard deviation of service rate \( \sigma _{\mu } = \frac{1}{\mu} \) . The formulation of measurement of effectiveness of M/M/1 queuing system are given below.
Input:
- Arrival rate (number of customers/unit time) \( \lambda \)
- Service rate (number of customers/unit time) \( \mu \)
Output:
- \( U \) = Utilization factor = percentage of the time that all servers are busy, \( U = \rho = \frac{\lambda}{\mu} < 1 \)
- \( P_{0} \) = probability that there are no customers in the system, \( P_{0} = 1 - \rho = 1 - \frac{\lambda}{\mu} \)
- \( P_{n} \) = probability that there are \( n \) customers in the system, \( P_{n} = \rho^{n}P_{0}; P_{n+1} = \rho P_{n} \)
- \( W_{q} \) = average time a customer spends in waiting line waiting for service, \( W_{q}=W-\frac{1}{\mu}=\frac{L_{q}}{\lambda} \)
- \( W \) = average time a customer spends in the system (in waiting line and being served), \( W=W_{q} + \frac{1}{\mu} \)
- \( L_{q} \) = average number of customer in waiting line for service, \( L_{q} = \lambda W_{q} \)
- \( L \) = average number of customer in the system (in waiting line and being served), \( L= \lambda W \)
Example:
Our observations of one cashier in a supermarket have shown that the arrival distribution of customers follows Poisson distribution with arrival rate of \( \lambda = 0.75 \) customers/5 minutes. The distribution of service time follows Exponential distribution with average service time \( \frac{1}{\mu}= 1.079 \) minutes per customer. Calculate the measurement of effectiveness of the queuing system.
Solution:
This problem is M/M/1 queuing system because we have only single server with Poisson arrival distribution and Exponential service time distribution. The arrival rate is \( \lambda = 0.75 \) customers/5 minutes = 0.15 customers/minute. Putting the same unit, we have average service time of \( \frac{1}{\mu} \) = 1.079 minutes per customer which is equivalent to \( \mu = 0.927 \) customers per minute.
Utilization factor = percentage of the time that all servers are busy, \( U = \rho = \frac{\lambda}{\mu} = \frac{0.150}{0.927} = 0.162 < 1 \)
\( P_{0} \) = probability that there are no customers in the system, \( 1 - \rho = 1 - \frac{\lambda}{\mu} = 1 - 0.162 = 83.8\% \)
Average time a customer spends in waiting line waiting for service, \( W_{q}=W-\frac{1}{\mu} = \frac{\lambda}{\mu \left ( \mu - \lambda \right )} = \frac{0.15}{0.927 \left ( 0.927 - 0.15 \right )} = 0.208 \) minutes.
Average time a customer spends in the system (in waiting line and being served), \( W=\frac{1}{\mu - \lambda} = \frac{1}{0.927 - 0.15} = 1.287 \) minutes.
\( L_{q} \) = average number of customer in waiting line for service, \( L_{q}= \frac{\lambda^{2}}{\mu \left ( \mu - \lambda \right )} = \frac{0.15^{2}}{0.927 \left ( 0.927 - 0.15 \right )} = 0.031 \) customers.
\( L \) = average number of customer in the system (in waiting line and being served), \( L=\frac{\rho}{1-\rho}=\frac{0.162}{1-0.162}=0.193 \) customers.
\( P_{n} \) = probability that there are n customers in the system, \( P_{n}=\rho^{n} P_{0} \)
<
Previous
|
Next
|
Contents
>
Do you have queuing problem? Consult your expert for a solution here
These tutorial is copyrighted .
Preferable reference for this tutorial is
Teknomo, Kardi. (2014) Queuing Theory Tutorial
http://people.revoledu.com/kardi/tutorial/Queuing/