
<
Previous
|
Next
|
Contents
>
Service Time Distribution
Service time distribution is one part of the supply side of your system. In some queuing system, the servers is not so clear. Knowing the actual servers in your queuing system is one of the most important challenge to solve your queuing problem. You probably need to consult a queuing expert just to point out which part of your system are actually the servers. The queuing servers can be your service point, staffs, cashiers, or machine. In a road intersection with traffic light, the server is the traffic signal length of time (green, red and yellow). In conference lunch, the servers can be the serving tables.
The ability of the servers to serve the customers will determine the system performance. The faster the server is able to serve, the better the system performance such as queue length and delay.
Similar to arrival distribution, to determine service time distribution, we collect data for each server over a given period of observation time (say for 12 hours of survey). The observer will record the time that one customer is started to be served and the time that the same customer has been served and leaving the waiting line.
Table below shows an example of observation results from one cashier in a supermarket. If you have more than one cashier, the same observation and computation below need to be performed for each cashier. The difference between completion time and the starting time is the service time. When the server is busy (not waiting for the arrival of customer), the starting time of the next customer is just a copy of the completion time of the previous customer (e.g. the server is busy to serve customer ID number 2 to 6).
|
Customer ID Number |
Time Start to be served |
Completion time |
Service time (minutes: seconds) |
|
1 |
10:01:05 |
10:02:36 |
01:31 |
|
2 |
10:05:18 |
10:06:12 |
00:54 |
|
3 |
10:06:12 |
10:07:37 |
01:25 |
|
4 |
10:07:37 |
10:08:48 |
01:11 |
|
5 |
10:11:48 |
10:12:38 |
00:50 |
|
6 |
10:12:38 |
10:13:57 |
01:19 |
|
... |
... |
... |
... |
|
535 |
21:42:27 |
21:44:09 |
01:42 |
|
536 |
21:44:09 |
21:46:19 |
02:10 |
|
537 |
21:46:19 |
21:47:49 |
01:30 |
|
538 |
21:47:49 |
21:49:43 |
01:54 |
|
539 |
21:52:59 |
21:54:13 |
01:14 |
From the last column of table above, service time distribution as shown in the table below can be derived. The average service time is \( \frac{1}{\mu} \) = 1.079 minutes per customer ( \( \mu=0.927 \) customers per minute).
|
Service time (minutes) |
Count |
Cumulative count |
Cumulative Distribution |
|
0 |
0 |
0.00% |
0.00% |
|
0.5 |
250 |
46.38% |
46.38% |
|
1 |
134 |
24.86% |
71.24% |
|
1.5 |
72 |
13.36% |
84.60% |
|
2 |
38 |
7.05% |
91.65% |
|
2.5 |
21 |
3.90% |
95.55% |
|
3 |
11 |
2.04% |
97.59% |
|
3.5 |
6 |
1.11% |
98.70% |
|
4 |
3 |
0.56% |
99.26% |
|
4.5 |
2 |
0.37% |
99.63% |
|
5 |
1 |
0.19% |
99.81% |
|
5.5 |
0 |
0.00% |
99.81% |
|
6 |
1 |
0.19% |
100.00% |
|
6.5 |
0 |
0.00% |
100.00% |
|
Sum |
539 |
100.00% |
This result is then compared to a theoretical distribution, and we found the cumulative distribution is close to the cumulative exponential distribution. Therefore, the probability that the service time will be less than or equal to a time length \( t \) is given by \( P(service\: time \leq t) = 1 - e^{-\mu t} \)
|
Service time (minutes) |
Count |
Cumulative count |
Observed cumulative distribution |
Theoretical Cumulative Distribution |
|
0 |
0 |
0 |
0.00% |
0.00% |
|
0.5 |
250 |
250 |
46.38% |
41.70% |
|
1 |
134 |
384 |
71.24% |
66.01% |
|
1.5 |
72 |
456 |
84.60% |
80.18% |
|
2 |
38 |
494 |
91.65% |
88.44% |
|
2.5 |
21 |
515 |
95.55% |
93.26% |
|
3 |
11 |
526 |
97.59% |
96.07% |
|
3.5 |
6 |
532 |
98.70% |
97.71% |
|
4 |
3 |
535 |
99.26% |
98.66% |
|
4.5 |
2 |
537 |
99.63% |
99.22% |
|
5 |
1 |
538 |
99.81% |
99.55% |
|
5.5 |
0 |
538 |
99.81% |
99.74% |
|
6 |
1 |
539 |
100.00% |
99.85% |
|
6.5 |
0 |
539 |
100.00% |
99.91% |
|
Sum |
539 |
|
|
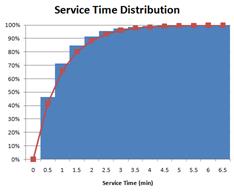
The chart below shows how close the theoretical distribution (line chart) to the observed distribution (bar chart). Both are in cumulative values
Most common type of service distribution in a queuing system is random that follow Poisson Process or sometimes is called as Markovian. Other type of service distribution is deterministic (e.g. constant time in a machine or traffic signal) or general unspecified distribution.
<
Previous
|
Next
|
Contents
>
Do you have queuing problem? Consult your expert for a solution here
These tutorial is copyrighted .
Preferable reference for this tutorial is
Teknomo, Kardi. (2014) Queuing Theory Tutorial
http://people.revoledu.com/kardi/tutorial/Queuing/