Normalization
In this section of Similarity tutorial, you will learn on how to put Distance or Similarity as Performance index into a range of 0 and 1 or [0, 1] in short. The process of transforming our index from its value into a range of 0 and 1 is called normalization . I will also briefly discuss about statistical normalization in this section.
Suppose the dissimilarity index is in the range of [
![]() ,
,
![]() ] and is not in the range of [0, 1]. We want to transform it into range of [0, 1]. Let us put notation
] and is not in the range of [0, 1]. We want to transform it into range of [0, 1]. Let us put notation
![]() to the original dissimilarity and
to the original dissimilarity and
![]() to the normalized dissimilarity.
to the normalized dissimilarity.
There are several ways to normalize an index. In principle, to aggregate a sequence of numbers into range of [0, 1] we need to make them positive and divide with something that is bigger than the nominator. Using this principle, we can make use any inequality to normalize the index. The following are simple transformations that can be used for wide range of application. Please take care of the condition of each transformation.
Check also below for
Statistical Normalization
and
Normalizing Negative Data
Mathematical Normalization Methods
1. One way to normalize an index is to use this function
The value of
![]() value will be in the range of -1 to +1 for
value will be in the range of -1 to +1 for
![]() . Equation (1) can be easily transform to range [0, 1] by transformation
. Equation (1) can be easily transform to range [0, 1] by transformation
![]() (2)
(2)
It gives
 (3)
(3)

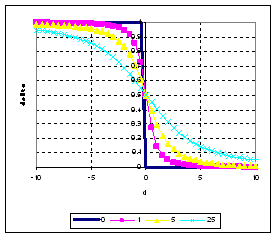
Setting higher value of
![]() will make the graph between
will make the graph between
![]() smoother as show in figure above. In general, when
smoother as show in figure above. In general, when
![]() produce
produce
![]() and if
and if
![]() , then
, then
![]() . For
. For
![]() , it produce binary value of 0 and +1 with discontinuity when
, it produce binary value of 0 and +1 with discontinuity when
![]() , thus
, thus
![]() shall not be used. The value of smoothing parameter
shall not be used. The value of smoothing parameter
![]() depends on how smooth we want to set and how large the value of
depends on how smooth we want to set and how large the value of
![]() is. For
is. For
![]() , the values of
, the values of
![]() in equation (3) can only
asymptotically
reach 0 or 1.
in equation (3) can only
asymptotically
reach 0 or 1.
For example,
![]() and
and
![]() then
then
![]()
2. If we know the maximum and minimum value of our index, then transformation
![]() (4)
(4)
It will change transform it into range of [0, 1]. If
![]() , then
, then
![]() . If
. If
![]() , then
, then
![]() . A special care must be taken to avoid division by zero when
. A special care must be taken to avoid division by zero when
![]() is zero. If the value of our index is always zero or positive, and we know the maximum value of our index, then we can set
is zero. If the value of our index is always zero or positive, and we know the maximum value of our index, then we can set
![]() and the equation (4) can be simplified into
and the equation (4) can be simplified into
![]() (5)
(5)
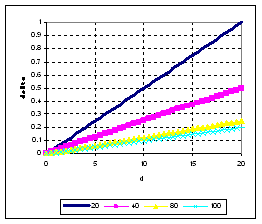
The graph of
![]() is linear and depending on
is linear and depending on
![]()

3. In case we know the value of our index is always zero or positive, but we do not know the maximum value of our index. Suppose the number of indices are fixed to be
![]() , then we can use total of the indices to replace the maximum value, become
, then we can use total of the indices to replace the maximum value, become
 (6)
(6)
The normalized value of (6) is smaller than (5) because
![]() . A special care must be taken to avoid division by zero when all indices are zero.
. A special care must be taken to avoid division by zero when all indices are zero.
4. If our index can take negative value, we can normalize each indices by taking its relative absolute value or square value to the total:
 (7)
(7)
or
 (8)
(8)
5. Bray Curtis Normalization . If we have a pair of indices which always zero or positive and both cannot be zero at the same time, we can normalize them using absolute difference divided by the summation.
![]() (9)
(9)
Removing the absolute sign will give range of
![]() as [-1, 1]. If
as [-1, 1]. If
![]() , then
, then
![]() . If one of the two indices is zero, then
. If one of the two indices is zero, then
![]() . For example,
. For example,
![]() and
and
![]() , we get
, we get
![]() .
.
See also:
Canberra distance
,
Bray Curtis distance
6. To normalized ordinal value of comparison index, perform the following steps:
-
Convert the ordinal value into rank (r = 1 to
 )
)
- Normalized the rank into standardized value of zero to one [0,1] by
![]() (10)
(10)
Example

See also: Distance for ordinal variables
7. We know from mathematics that for any positive values,
arithmetic mean
is always larger or equal to
geometric mean
. We can use this knowledge to normalize our index. Provided that
![]() , we have
, we have
 (11)
(11)
For example
![]() and
and
![]() , we get
, we get
![]()
See also: Mean and Average
8. Another inequalities from mathematics theory said that absolute value of
arithmetic mean
is smaller or equal to
quadratic mean
. We can use this knowledge to normalize our index for any real value of
![]()
 (12)
(12)
For example
![]() and
and
![]() , we get
, we get

Normalizing negative data
All above normalization will work well if your data is positive or zero. How if your data contain some negative numbers? For example, you have data -1, 3 and 4. The sum is 6. If you normalize it by the maximum value you will get
-1/6, ... , and 2/3. The sum of the three is still one but now you have negative number (-1/6) as part of your index. How to solve this problem?
The solution is simple: Shift your data by adding all numbers with the absolute of the most negative (minimum value of your data) such that the most negative one will become zero and all other number become positive. Then you can normalize your data as usual with any of above procedures.
For example:
Your data is -1, 3 and 4. The most negative number is -1, thus you add all numbers with +1 to become: 0, 4, 5 then normalize it become: 0, 4/9 and 5/9.
Statistical Normalization
Finally, I would like to give a note about another type of normalization which also called Statistical normalization. The purpose of statistical normalization is to convert a data derived from any Normal distribution into Normal distribution with mean zero and variance = 1.
The formula of statistical normalization is
Z = (X-u) /s
You have your data as vector X then you minus with the mean of the data, u, and divide this difference by the standard deviation , you will get another vector Z that has normal distribution with zero mean and unit variance (it is also called Standard Normal distribution, N(0,1) ). However, the range of the standard Normal distribution is not between [0,1]. The range of standard Normal distribution is about -3 to +3 (actually infinity to infinity but using -3 to +3 you already capture 99.9% of your data).
For example:
You have data:
 ,
,
your mean data is (2+5+3+1)/4 = 12/4 = 3, the standard deviation is
![]()
The Z values are

Preferable reference for this tutorial is
Teknomo, Kardi (2015) Similarity Measurement. http:\people.revoledu.comkardi tutorialSimilarity

